Most new Forex traders don’t know the difference between support and resistance. Let alone using support and resistance with their Forex trading. If you’re a beginner trader and want to learn more on support and resistance in Forex then you’re in the right place!
The difference between support and resistance in Forex is knowing what a horizontal level of price support and price resistance is. Also when price breaks a resistance and then becomes a new level of support, and when price breaks a support and then becomes a new level of resistance. The more times Support or Resistance is tested, the weaker it can become.
In my trading lesson today I will cover all the aspects you need as a new trader. When it comes to unlocking the markets and understanding the difference between support and resistance.
Having a solid Forex trading education on the basics of support and resistance trading, is the starting point for any successful trader. The difference between support and resistance in Forex I will cover are;
- Horizontal level of price resistance
- Horizontal level of price support
- Resistance becomes a support
- Support becomes a resistance
- Sideways and dynamic support and resistance
Horizontal Level Of Resistance
Using a horizontal level of resistance with the difference between support and resistance:
Difference between support and resistance with using a horizontal level of resistance, will always act as a reversal point on the chart when selling. This can be in a sideways moving market (range bound market), or with the trend direction (trading with a bearish trend).
Price Resistance
A major area of price resistance is a level or an area on the chart at which a supply will overwhelm an existing demand. In other words, this is an area on a chart when the selling at the supply which was light, begins to overwhelm the buying.
For you this then offers an unique selling opportunity, to sell from the resistance on the price chart. The key thing to always remember is that resistance can always be defined by the following term. (A current high will revisit a prior high).
A resistance can be seen on a price chart as stated above when price revisits a prior high. On the example below this shows a retest on several occasions at a prior high, with giving you an opportunity to sell.
Horizontal Level Of Support
Using a horizontal level of support
The difference between support and resistance with a horizontal level of support, will always act as a reversal point on the chart when buying. This can be in a sideways moving market (range bound market), or with the trend direction (trade with a bullish trend).
Price Support
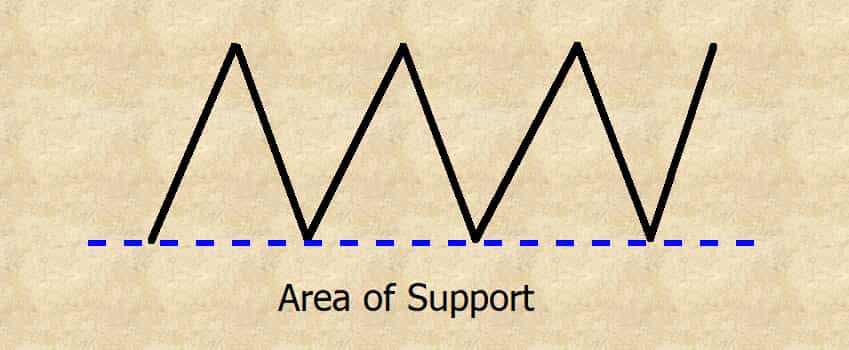
A major area of price support is a level or an area on the chart at which a demand will overwhelm an existing supply. In other words, this is an area on a chart when the buying at the demand which was light, begins to overwhelm the selling pressure.
For a trader this then offers an unique buying opportunity, to buy from the support on the price chart. The key thing to always remember is that support can always be defined by the following term. (A current low will revisit a prior low).
A support can be seen on a price chart as stated above when price revisits a prior low. On the example below this shows a retest on several occasions. At a prior low, with giving you an opportunity to buy.
Resistance Becomes A Support
The difference between support and resistance when using a resistance becomes a support
In this next step of the difference between support and resistance. I am going to cover the aspect of when a resistance becomes a support and vice versa. This section of my trading lesson is very important to understanding how I trade the markets.
With using what is called a Forex Swing Trading strategy. If this is something you would like to learn more about then check out another trading lesson of mine with:
“Forex Swing Trading: My Ultimate Guide [2019] +PDF Blueprint”
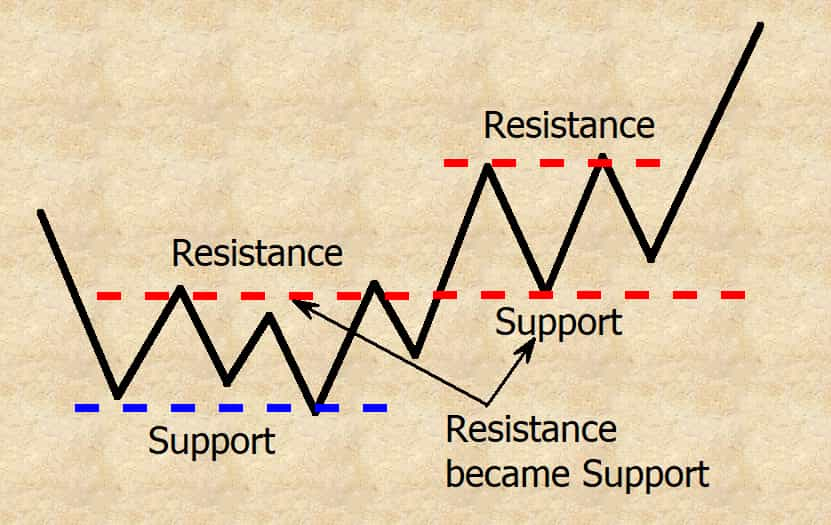
With the difference between support and resistance, you are going to find when a resistance becomes a support. Is when buyers (demand) overwhelms sellers (supply), with price being able to breakout of a resistance. As just like a horizontal level, price then will reverse of the newly formed level of support.
Price Resistance Turns To Price Support
A level or area of resistance once broken, can then become a level or area of support. Just as the horizontal level of price resistance or support. You would look for any trade opportunities to come of the new support.
For this to happen the buyers (demand) would first have to overwhelm the sellers (supply) for the resistance to be broken. Then on the move back into the broken resistance you would look for signs of buyers (demand) once again to take control.
A broken resistance to become support can be seen on a price chart as stated above. On the example below this shows a retest of the broken support after breaking the resistance giving you an opportunity to buy.
Check out what a resistance becomes a support looks like on a price chart…
Support Becomes A Resistance
Using a support becomes a resistance
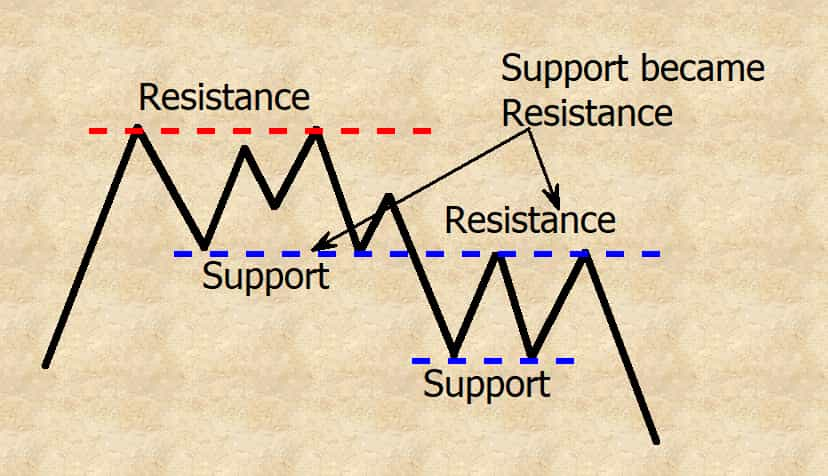
Using the difference between support and resistance, a support will become a resistance, when sellers (supply) overwhelms buyers (demand) with price being able to breakout of support. As just like a horizontal level price then will reverse of the newly formed level of resistance.
Price Support Turns To Price Resistance
A level or area of support once broken, can then become a level or area of resistance. Just as the horizontal level of price support or resistance. You would look for any trade opportunities to come of the new resistance.
For this to happen the sellers (supply) would first have to overwhelm the buyers (demand) for the support to be broken. Then on the move back into the broken support you would look for signs of sellers (supply) once again to take control.
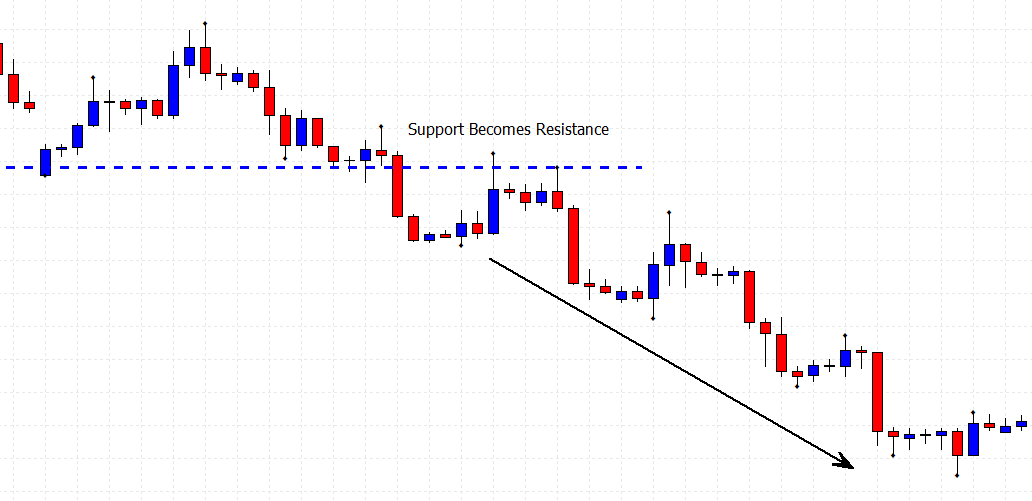
A broken support to become resistance can be seen on a price chart as stated above. On the example below this shows a retest of the broken resistance after breaking the support giving you an opportunity to sell.
Check out what a support becomes a resistance looks like on a price chart below…
Sideways and dynamic support and resistance
Also using the difference between support and resistance. You can find either a sideways (range bound) or dynamic (trend) level or area of support and resistance. So in this final part to my trading lesson today, I will cover exactly how these patterns construct and will look on your charts.
Sideways (Range Bound) Support & Resistance
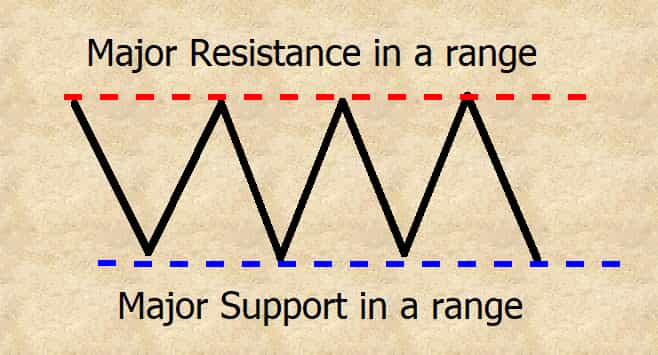
Just as the price resistance and price support levels discussed earlier, you can find price trapped within the two. Causing a sideways market or more commonly known as a range. This will show that neither the buyers (demand) or the sellers (supply) have full control of the market unlike a trend.
In other words each time the sellers push price into the support. The buyers (demand) will overwhelm the sellers (supply) reversing price back up to the resistance. Where the sellers (supply) will overwhelm the buyers (demand) which creates the whipsaw effect.
On the example below shows how this whipsaw effect will look, when price gets trapped between a support and resistance level.
To see what a sideways market looks like on a price chart below…
Dynamic (Trending) Support & Resistance
How a dynamic support and resistance forms:
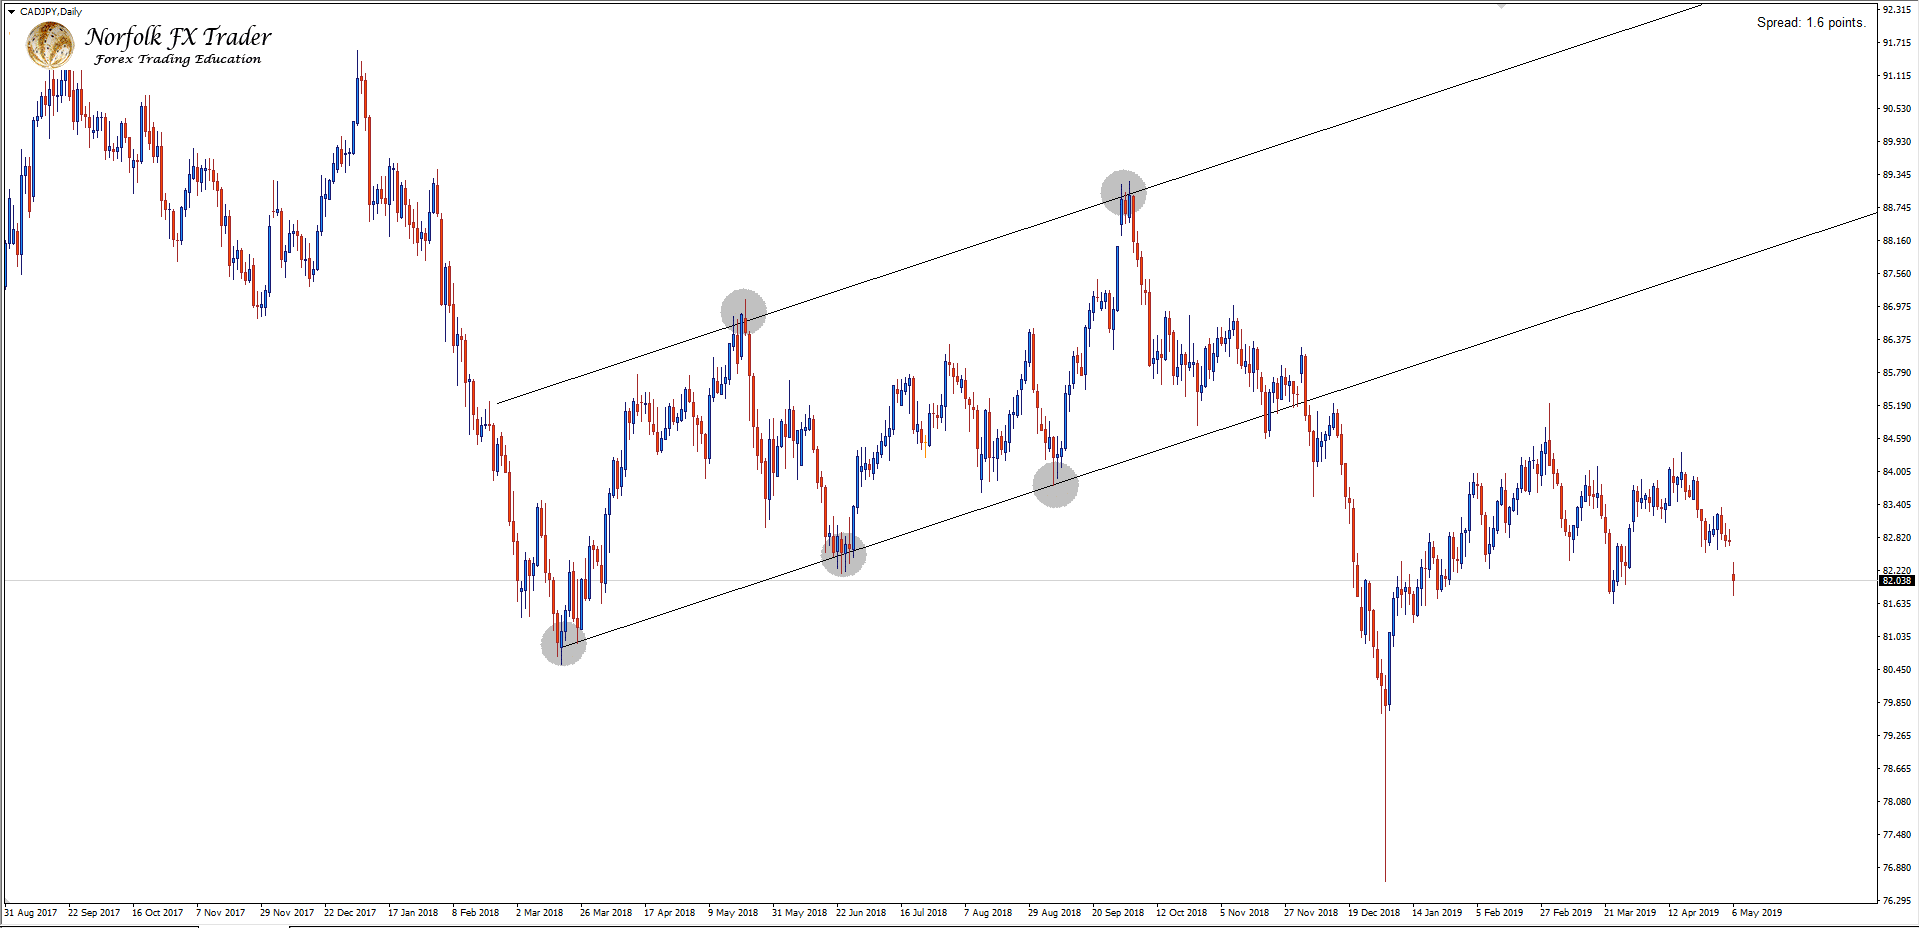
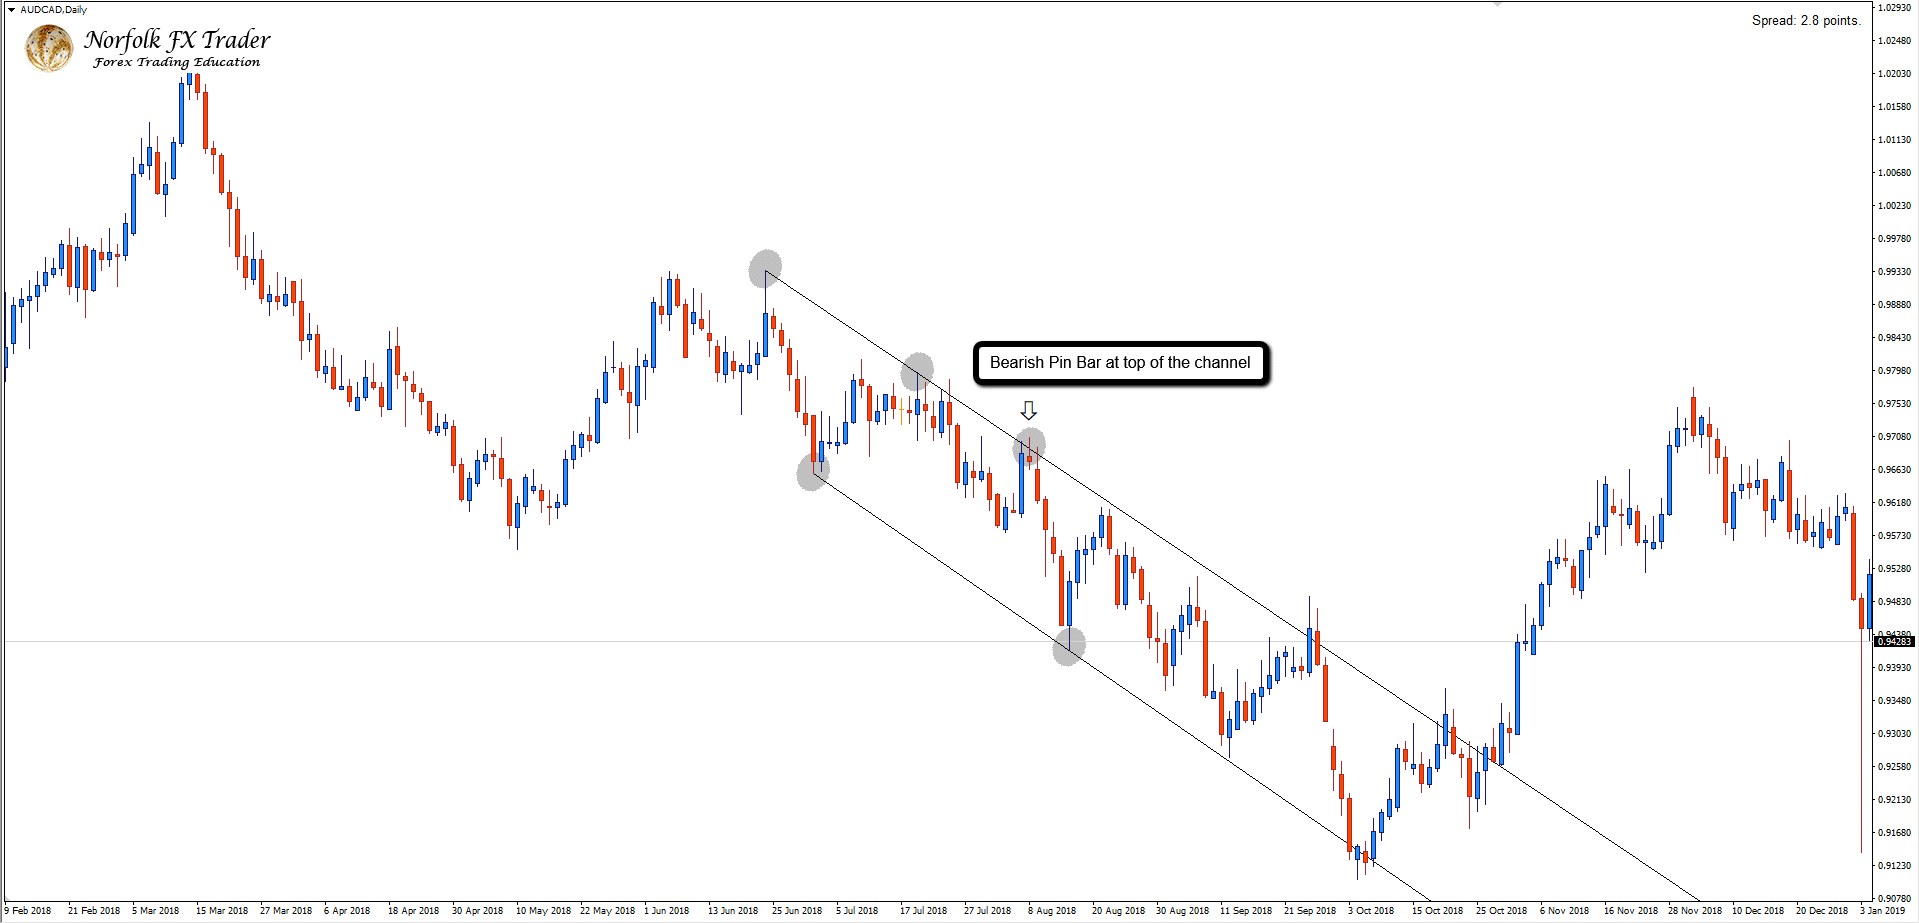
Just as the sideways market, price will be trapped within a diagonal channel of support and resistance. On a price chart this will be outlined by using two trend lines.
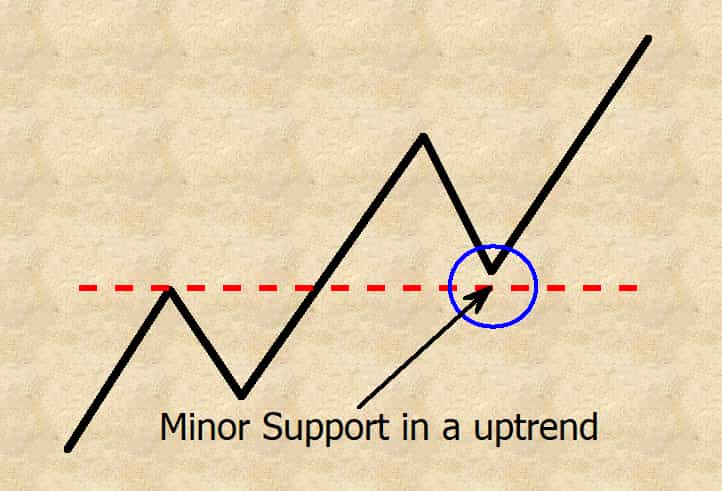
Marking the lows and highs of the swinging pattern in the trend. In a up trending market the support will act as the dominate level or area on the chart. When buyers (demand) will overwhelm the sellers (supply) as price swings higher.
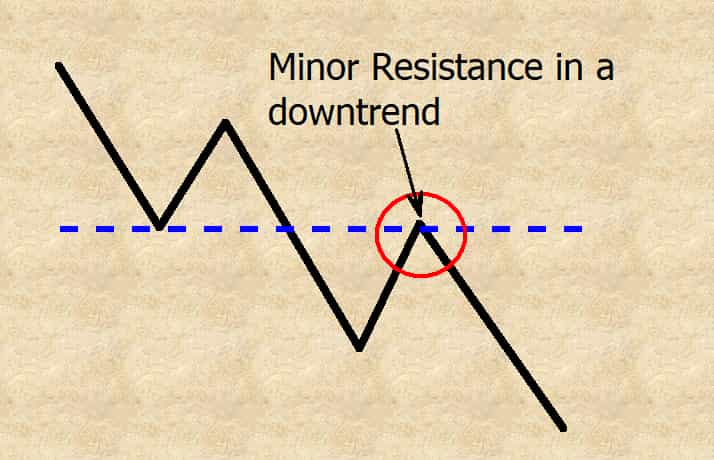
In a down trending market the resistance will then act as the dominate level or area on the chart. Where sellers (supply) will overwhelm the buyers (demand) as price swings lower. On the examples below, these will show how the support and resistance would look on a chart with a up trend and down trend channel.
Now lets see what these two dynamic trends would look like when on a price chart.
Find more basics of Forex trading here
Final thoughts
With a much better understanding now of the difference between support and resistance, within this trading lesson today. You should now know when to expect the market to turn at a key area on the chart.
You will now know when the market is in a range bound market or a trending market using the outer boundaries. Once you master this technique of trading, you can then progress onto further advanced types of trading. If you’re ready for the next step, then you will want to check out my Forex swing trading system clicking here.


