
Do you struggle with how to draw trend lines correctly, and find however you try to draw them you just can’t seem to profit with using trend lines. If so, then you’re in the right place!
The correct way to draw trend lines is to draw trend lines at an angle on a price chart which is used to determine a trend direction and helps with your trading decisions. Such as in an uptrend, trend lines are drawn below current price and in a downtrend, trend lines are drawn above current price. When drawing trend lines you need to connect the first two swing points in an up trend or a down trend.
In today’s trading lesson naked traders, I am going to cover the correct way to draw trend lines so you will be able to profit time and time again using just trend lines and price in the Forex markets. What I will cover…
- what are trend lines and what they are used for
- the correct way to draw trend lines
- step by step plan to drawing trend lines efficiently
- the trend line breakout strategy
What Are Trend Lines And What They Are Used For?
Trend lines are basically as the name implies, with levels that are used with the trend in technical analysis. Which are drawn as lines within your charts with trends to show areas of diagonal support or resistance areas.
Where you may already use horizontal levels of support and resistance, think of trend lines as diagonal levels drawn on your charts, to show diagonal levels of support or resistance with the current trend.
These trend lines can be used to show us those potential turning points within a trend. Where buyers will overwhelm sellers at an area of demand. Or where sellers will overwhelm buyers at an area of supply. Lets now take a look at what a trend line will look like when used with the trend.
Below is an example of what a uptrend line would look like when applied to a price chart…
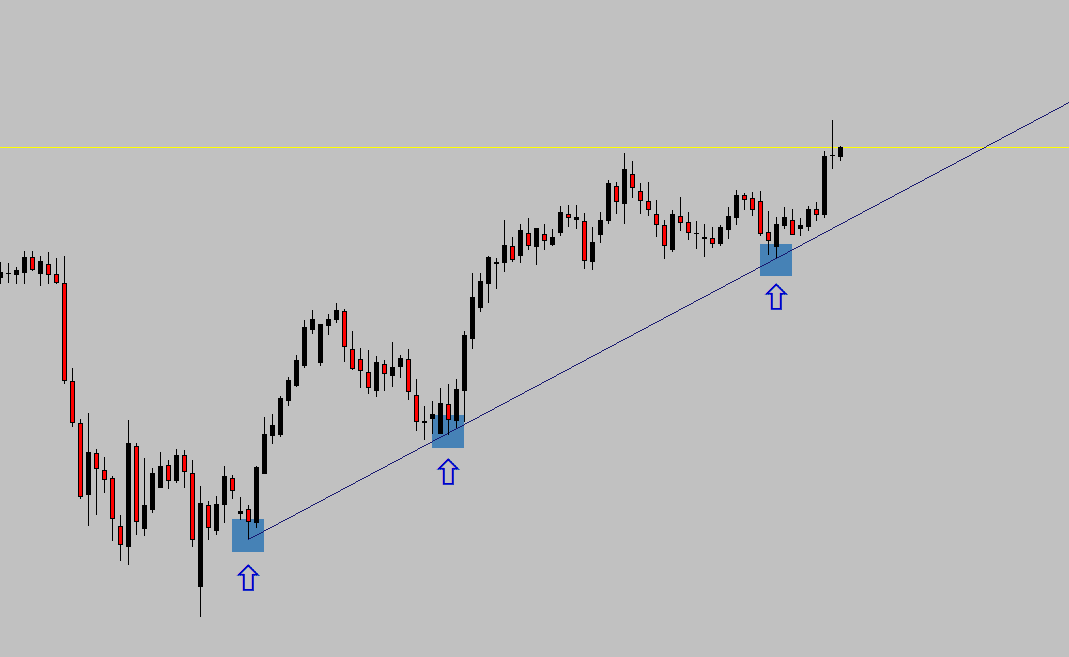
Notice how on the price chart above, price respected the trend line on several occasions. Where there would have been buyers stepping in to buy the market higher. So the trend line was used visually to see price respecting it as a level of bullish horizontal support.
Now lets look at what a bearish downtrend trend line would look like…
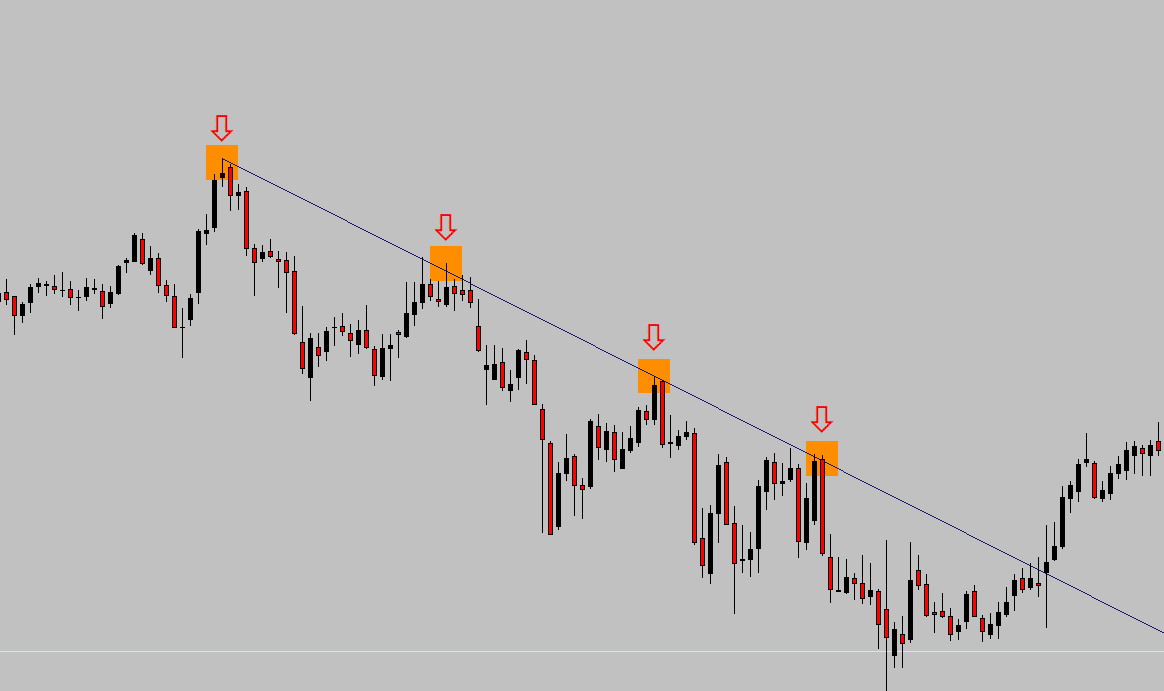
Just like the bullish up trend, we have the same bearish reaction of the bearish trend line. With price respecting the trend line as sellers step in to sell this market. So the trend line was used to visually see price respecting it as an level of horizontal level of resistance.
So when you are looking to identify a trend within the Forex markets, you can use the correct way to draw trend lines, to identify horizontal levels of support and resistance. But first you need to know the correct way to draw trend lines. That’s exactly what I will cover next…
The Correct Way To Draw Trend Lines
To demonstrate to you how to draw trend lines correctly, the most effective way is to actually show you within a video how I personally draw them in the markets.
So to effectively draw trend lines that you can use to trade off in the markets. You need to always start with two swing points within the charts. This can easily be identified by the use of fractals.
Below is an example of a price chart, using just two swing points to mark of a trend line within a bullish market.

You will notice on the above price chart, there was two swing points used to mark out the bullish trend line. This would be how you would use the two swing points within the market to find potential setups.
On the next price chart below, see how when price returned to this trend line once again. It was respected and created a bullish spinning top candle right at the trend line for an entry to go long.

So when applying the two swing points for each and every trend line you place within your price charts. This will enable you to find potential entries in line with the trend as indicated by using the trend line.
Step By Step Plan To Drawing Trend Lines Efficiently
So when you start to look to draw out your trend lines, you will want to follow this step by step plan. This will then enable you to draw your trend lines efficiently to give you the very best results.
In this step by step plan, I will cover…
- how using the Daily time frame will give you the very best results
- don’t just draw a trend line for the sake of it
- draw your trend lines from the candle wick highs or lows, don’t overlap the candles
The Use Of The Daily Time Frame With Trend Lines
To get the very best results with the correct way to draw trend lines, is to use the Daily time frame. The majority of the large banks and institutions are only watching those larger time frames.
So it would make sense to look at trading these yourself, to be in line with the traders who actually move the markets.
Another reason why I prefer to use the Daily time frame with my own trading, is because of the reliability it gives you. Compared to the lower time frames, the daily will cut out all of the noise that comes with trying to trade the lower time frames.
So with using trend lines this is no exception, and will help you to capture higher profitability trades. With using the Daily time frame, this will also allow you to look for Daily candlestick patterns to form at the test of the trend line. To read more on the basic candlesticks you can use with trend lines check out this post I wrote all on the basics of candlesticks clicking here.
Lets now take a look at how using the Daily time frame with marking out your trend lines correctly with a candlestick pattern for an entry would look like.

On the above price chart, see how price once again respected the trend line on the third test with a bullish rejection candle. This is where you could have entered into a long position and made a nice profit.
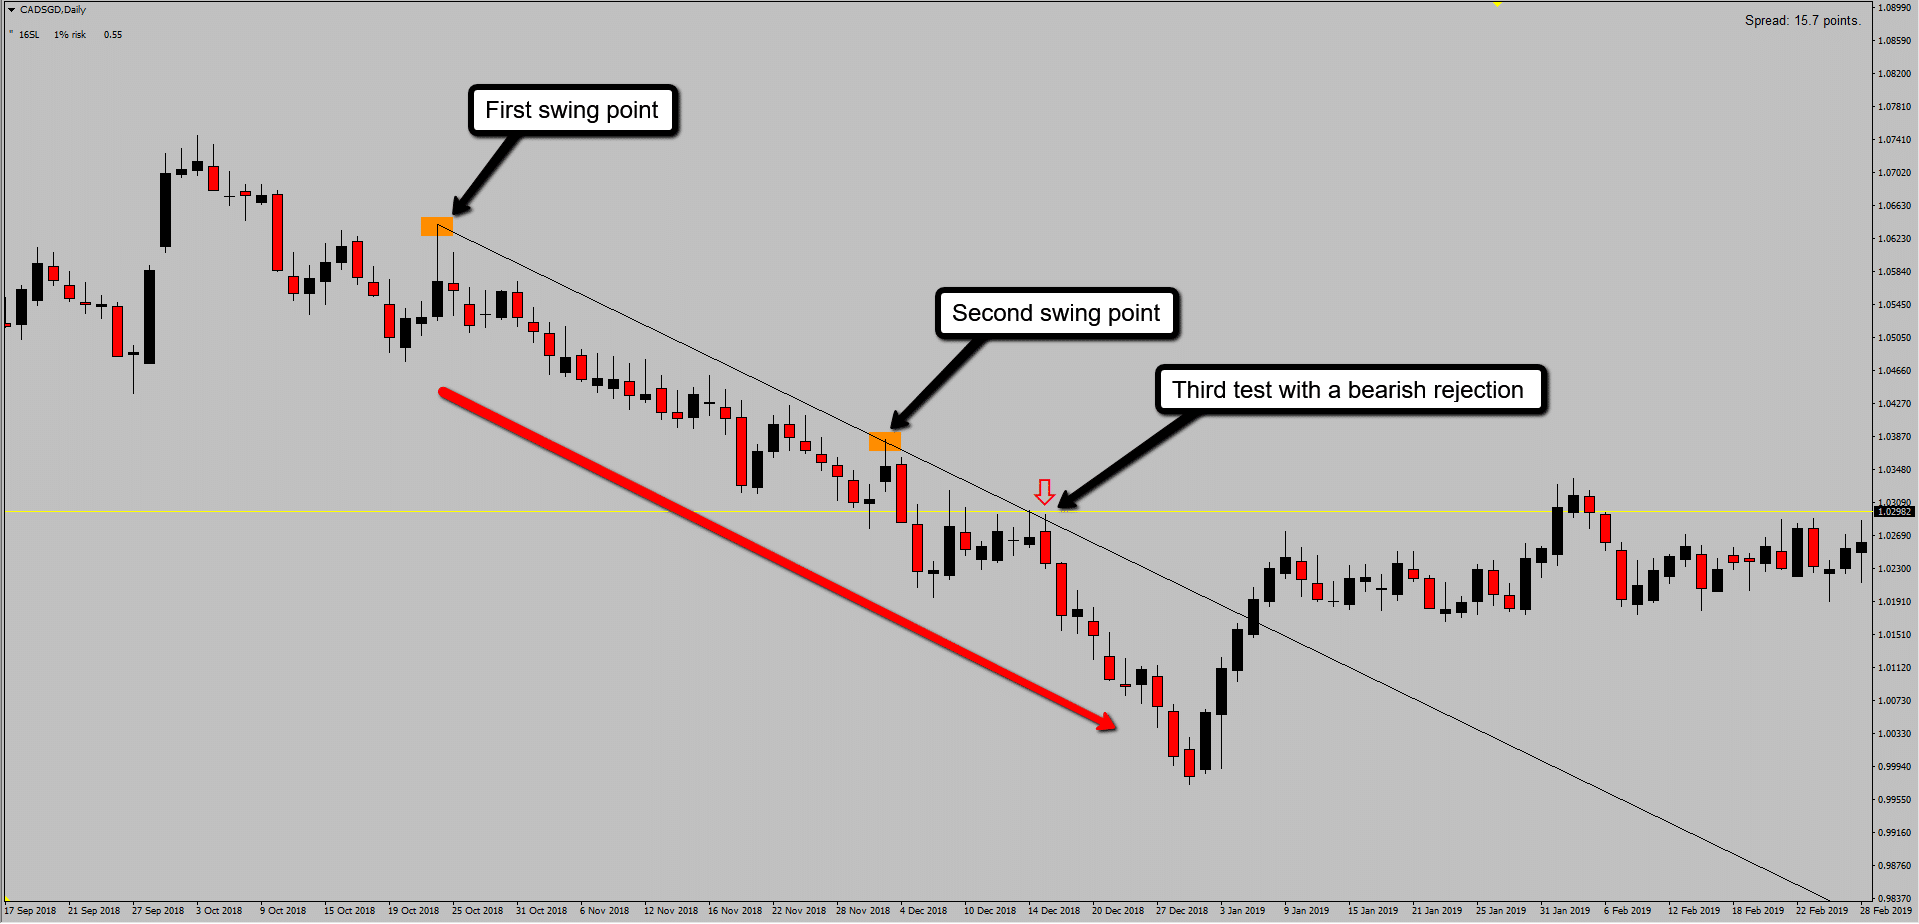
This time we had a sell trade setup coming of the trend line on the Daily time frame of the CADSGD pair. On the third test price respected the trend line and created a bearish rejection away, creating a good time to sell the market.
To take this one step further, with understanding how you could use the correct way to draw trend lines with the third test of a trend line to capture winning trades. I suggest checking out my free course with the third test of a trend line to capture winning trades.
You can find this course by signing up for free online workshop right now by clicking here.
Only Draw Trend Lines When It Makes Sense
This step will help you to make sure you don’t fall into the trap that many other traders find themselves in. With the correct way to draw trend lines, you need to always keep in mind. Not to just draw a trend line to make it fit.
What do I mean?
We’ll this is what we call “curve fitting” and it happens when a technical trader is so convinced that a level should exit, that the trader begins to try to make the level fit the price action on the chart.
This brings me to the most important part about drawing trend lines, or any support or resistance level for that matter. The best trend lines are the most obvious ones. So if a trend line doesn’t fit well, it’s probably best to move on to another pattern.
This applies more so to the next section of this plan, with making sure when you draw your trend lines. Not to overlap candle bodies and to mark only the wick highs or lows.
Don’t Overlap The Candles When Drawing Trend Lines
One of the worst mistakes you can make with how to draw trend lines correctly is to draw your trend line overlapping candlestick bodies. You need to always look at drawing the trend line at the wick highs or lows linking only these points in the market.
Below is an example of how not to draw out your trend line, Notice how the trend line goes through the candlestick bodies.

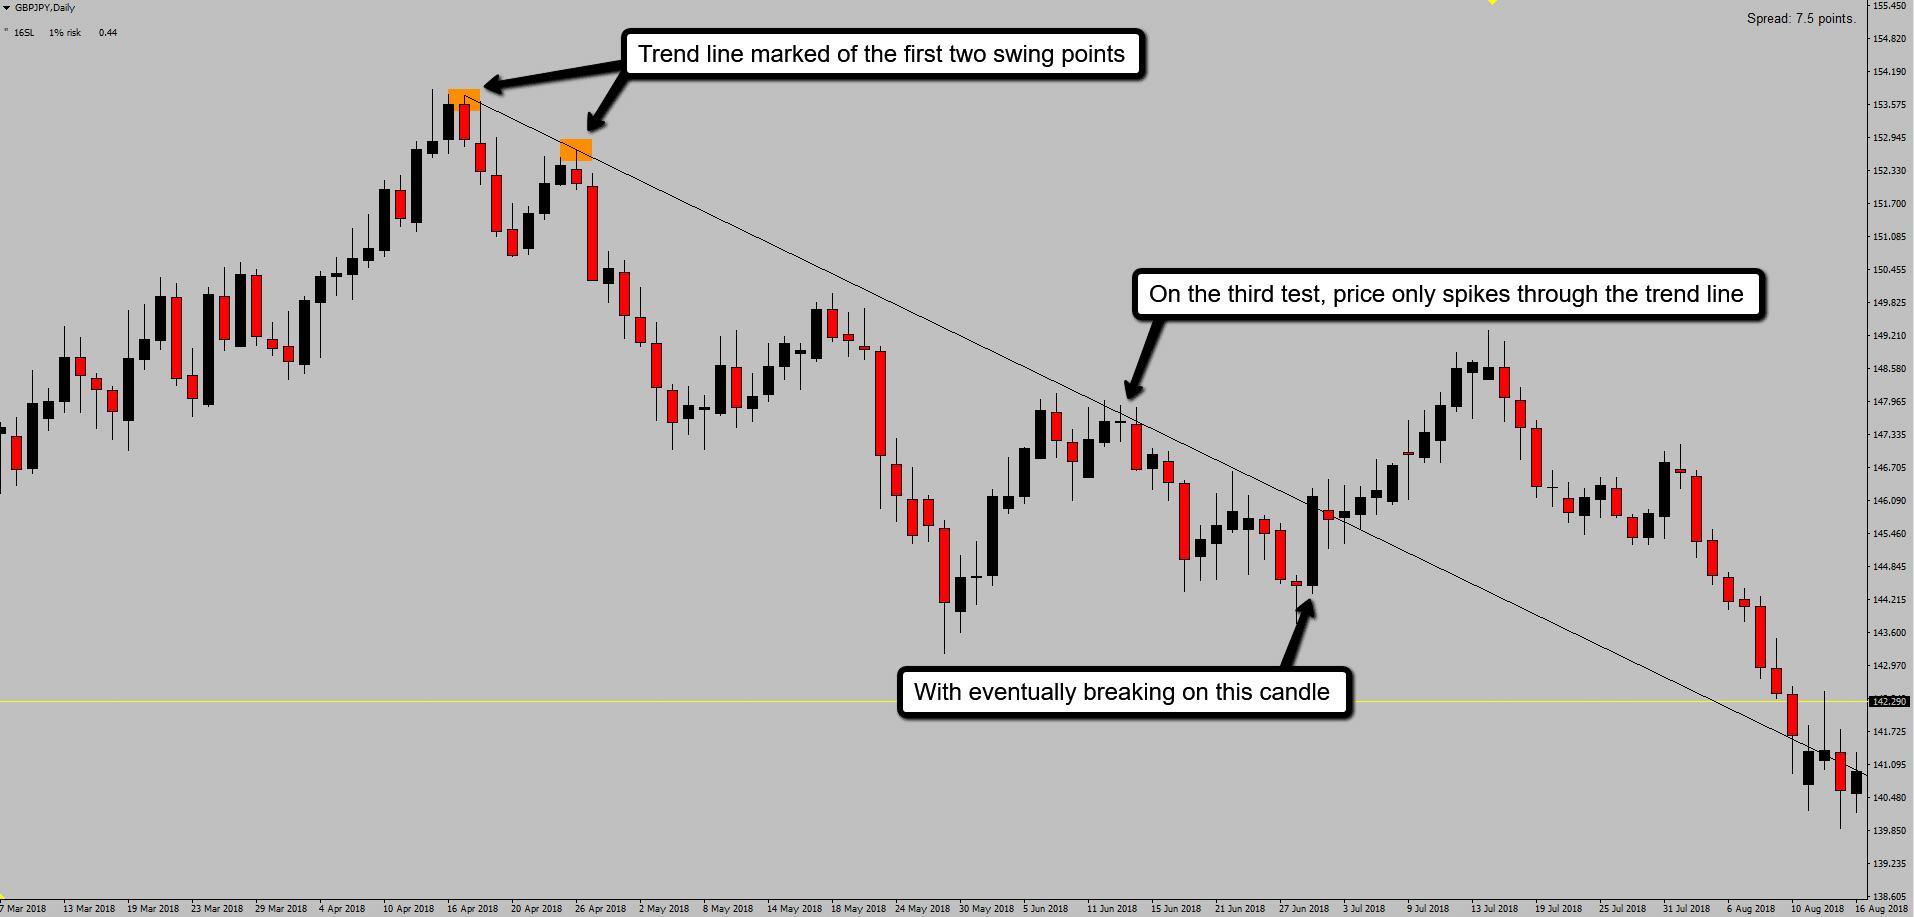
Very rarely do you find perfect trend lines to draw on your charts. This then means from time to time you may find you have to draw out a trend line, that doesn’t link of just the highs or lows of the candle wicks.
This is going to be acceptable as long as you still have your first two swing points marked. And you see price respects the trend line with never actually breaking and closing the trend line, just as sown above. This will be obvious with the candle wicks spiking through the trend line.
Lets now take a look at how this will look on your charts…
Now you have the step by step plan to always making sure you mark out your trend lines correctly. With having the highest probability to wining your trades.
Remember to always use the Daily time frame, and to mark of the first two swing points with every trend line you mark. Don’t just draw a trend line for the sake of drawing one, and always draw your trend lines of wick highs or lows, and never through the candlestick bodies.
Now you have a much better understanding of how to draw trend lines correctly. Check out in this next section the trend line breakout strategy that you can use to start profiting from the Forex markets today!
The Trend Line Break Out Strategy
This strategy will allow you to capture winning trades with either a reversal in the market or in line with the overall trend after a retrace move has been made in a trend.
The breakout is going to be when price breaks and closes the trend line. You must see a solid break and close of the trend line before looking to take a trade. Just as you have learnt already going through this trading lesson, you are going to need to start with drawing your trend line of the first two swing points in the market of the trend.
Then you will be looking to capture either a bounce of the third test of the trend line to take an entry with the trend. Which you can check out that free online workshop by clicking here.
Or using this breakout strategy, you will need to see the breakout with the break and close of the trend line. Lets take a look of what this would look like when marked on a price chart.
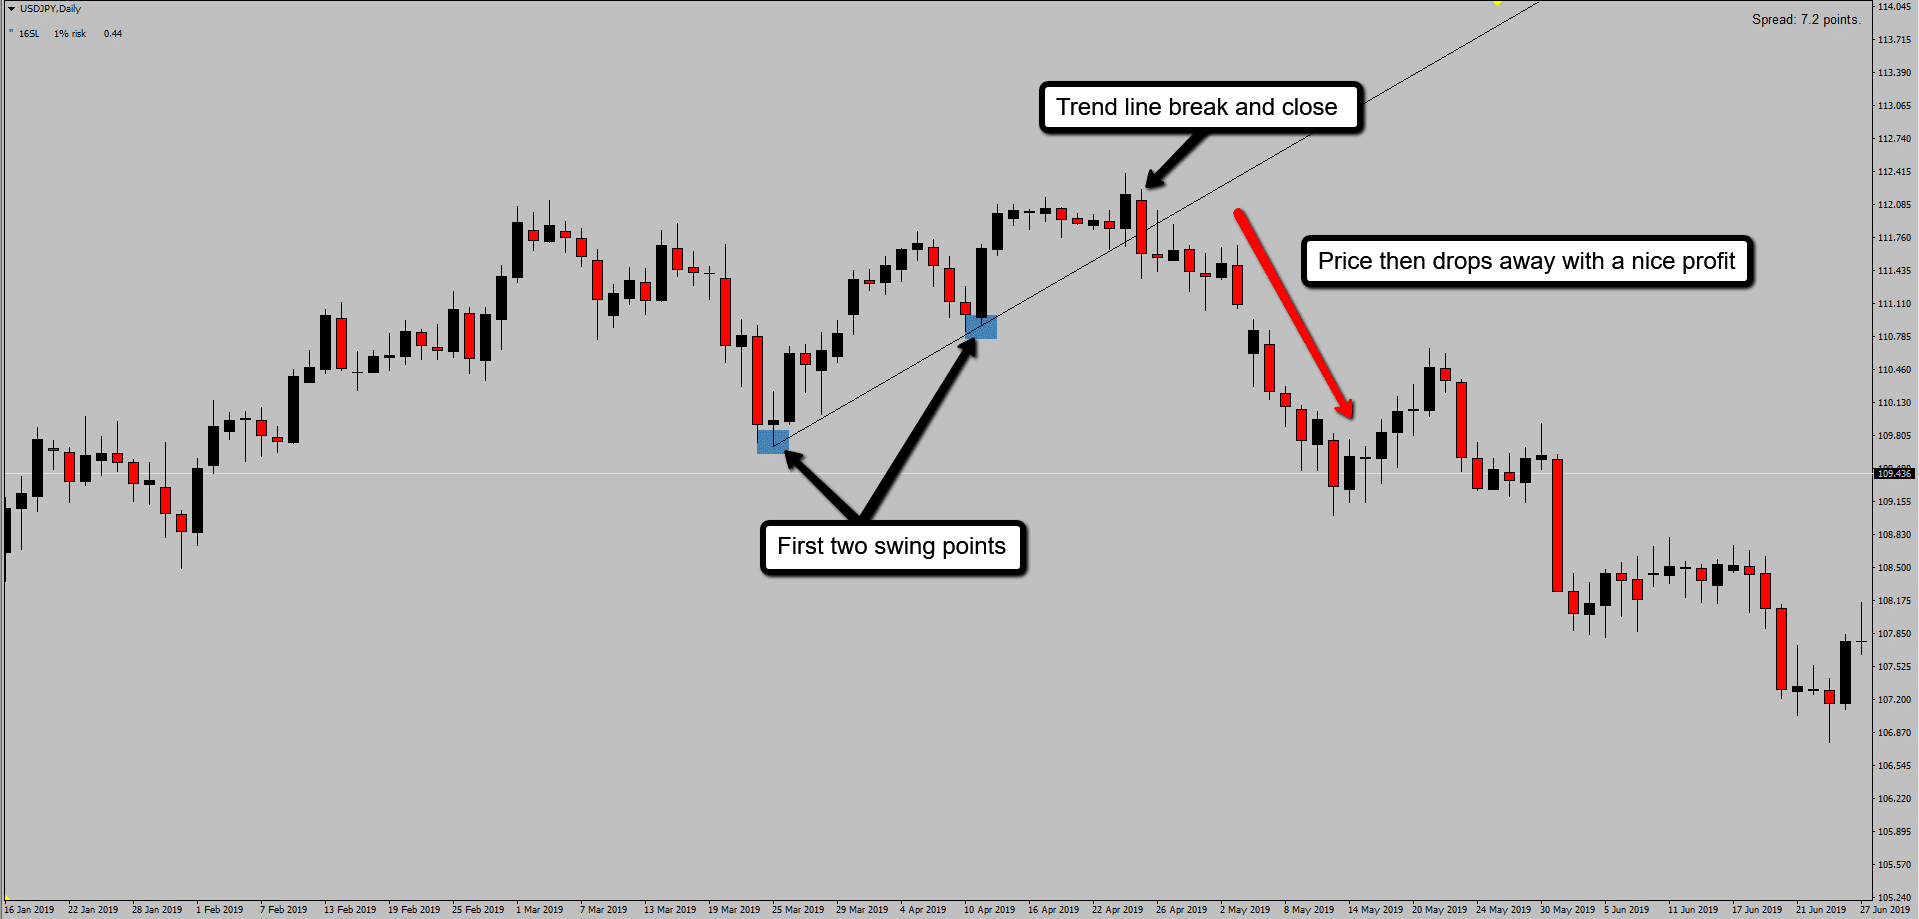
As you will see from the chart above, when price came back to test the trend line on the third test. It actually broke through and closed lower, creating a good opportunity to take a sell. Now, this would have been a reversal trade against the market bias which was bullish.
Lets take a look at a entry with the trend line breakout strategy with the overall trend direction.

Final Words
I hope this trading lesson has given you a better understanding of how to draw trend lines correctly and how they can be used in the Forex market.
I’ve covered a lot in this trading lesson, so let’s recap some of the important points on how you can draw trend lines like a pro!
- Think of trend lines as the diagonal equivalent to horizontal support and resistance levels.
- Trend lines will help you to identify buying and selling opportunities that occur within a strong trending market.
- The use of the Daily time frame will always produce the most reliable trend lines.
- Always look to mark your trend lines of the swing points in the market, and not through candlestick bodies.
- Never try to force a trend line to fit on your charts, if it doesn’t fit then there isn’t a correct trend line to draw.
- Using the trend line breakout strategy always remember to have a valid break and close of the trend line.
