Are you struggling with how to make profits with continuation price patterns in Forex? Do you know which continuation price pattern you should be trading for the best returns? If not, then you’re in the right place!
You can make profits with continuation price patterns in Forex, with trading the best performing patterns. Patterns such as the bullish ascending triangle, bullish flag, bullish consolidation and the bullish symmetrical pattern when buying the market. When selling the markets, you would look to trade the bearish descending triangle, bearish flag, bearish consolidation and the bearish symmetrical triangle pattern.
So in this trading lesson I’m going to cover how explosive these patterns can be! Having a solid Forex trading education on basic continuation price patterns, is the starting point for any successful trader. I will go through in this trading lesson, how you can use continuation plays with your trading.
These are my preferred basic technical price patterns to use, and I’m sure you will find them very profitable too.
Continuation Plays
How to make profits with continuation price patterns in Forex?
Using continuation price patterns, are the very high profitability setups that will form in trending market conditions. These patterns are known to be in congruence with the flow of price. Therefore, this will stack the odds in your favour when taking trades.
When you see price on the chart forming into these formations, which I will cover each pattern below. You will have a VERY high profitability setup that you will be able to take advantage off. As a trader you will want to pay attention to these formations, as they will give you an indication of what the market is wanting to do.
Which is to continue in the direction of current trend or price movement that precedes the formation. This is exactly why I love trading these formations and why you will too!
The basic continuation price patterns I will cover
- The bullish ascending triangle pattern
- The bearish descending triangle pattern
- A bull flag pattern
- A bear flag pattern
- The bullish consolidation pattern
- The bearish consolidation pattern
- Bullish symmetrical triangle pattern
- Bearish symmetrical triangle pattern
Bullish Ascending Triangle
One of the continuation price patterns, with how to make profits with continuation price patterns in Forex, being the Bullish Ascending Triangle (also known as the flat top triangle). Is one of the common formations I use to catch an entry with the bullish trend.
How the continuation price pattern being the bullish ascending triangle will form:
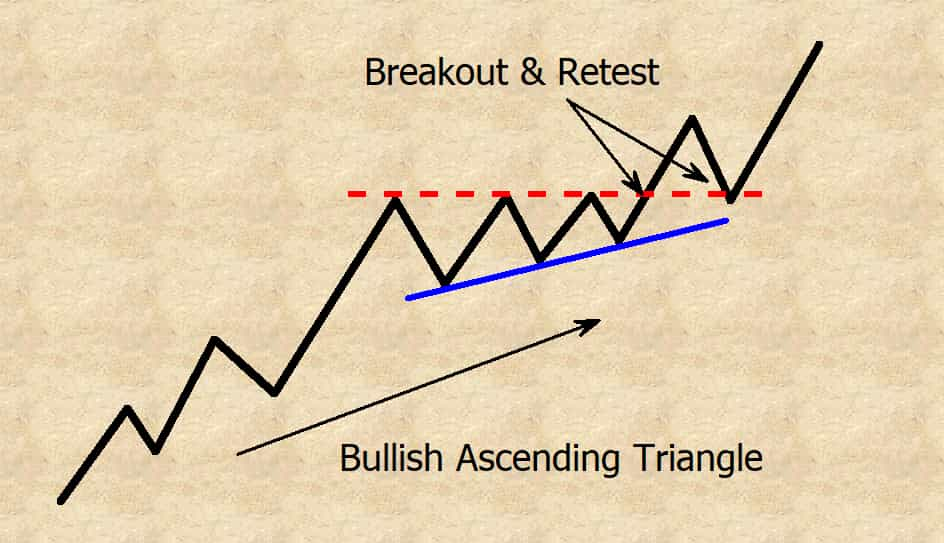
The bullish ascending triangle formation, will normally form after a strong upwards movement has been made within the markets. What will happen, is price will find an area or level of resistance as the pattern forms. From this point on the chart, price will be reversed away making the first bounce of the resistance.
This now, will form the starting point of the bullish ascending triangle. Price will then form a higher low and be pushed back higher from the buyers back into the previous resistance.
Afterwards, price movement will be consistent over a few more times until we have the bullish ascending triangle formed. Below is an diagram of what a bullish ascending triangle formation would look like.
As you can see from the above example of the bullish ascending triangle formation. There was two more occasions the resistance level formed from the first bounced was retested. Therefore, creating two more higher lows hence forming the makeup of the flat top triangle.
Entry Criteria
When you would look at taking an entry with the trend using this formation. The typical entries are-
- Breakout entry of the top resistance level, with targeting a target at the same distance as from the first higher low to the resistance level within the formation. (This would be an more aggressive approach)
- As outlined on the above image, wait for the breakout and retest to take an entry. (This being a more conservative approach)
Something to consider with how to make profits with continuation price patterns in Forex, is when you are looking to trade this pattern. Is waiting for the retest is more likely to give you a higher percentage chance of being successful.
Most importantly you can not confirm this technical price pattern until the top resistance has been broken and closed above. As on the price chart I have shown below, this pattern has not been confirmed as there has not been a valid breakout.
Find out more on this topic, with when you should wait for a pattern to be confirmed, on a recent article I wrote by clicking link below;
“4 Forex Market Trading Mistakes That Cause You To Lose Profits! (+Fixes)”
See below what a bullish ascending triangle looks like on a price chart…
Bearish Descending Triangle
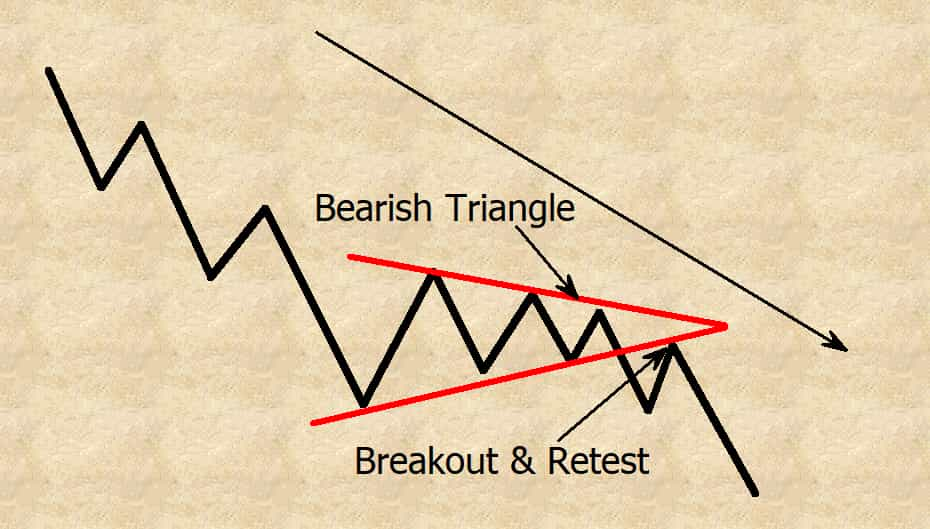
The opposite continuation price pattern, to the bullish ascending triangle is the Bearish Descending Triangle (also known as the flat bottom triangle).It is another one of the common formations used to catch a entry with the bearish trend.
How to make profits with continuation price patterns in Forex with the bearish descending triangle and how it forms
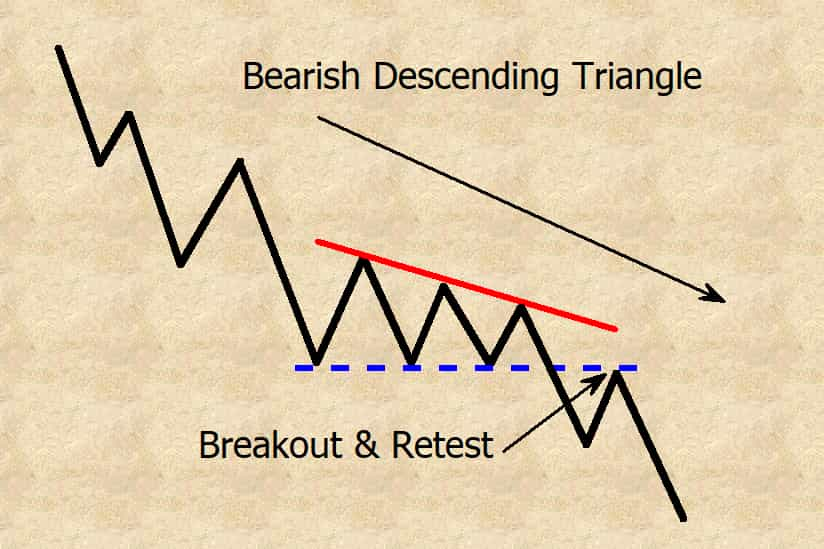
The bearish descending triangle formation, will normally form after a strong downwards movement has been made within the markets. What
happens, is price will find an area or level of support as the pattern forms. From this point on the chart, price will be reversed away from the support making this the first bounce of a newly formed support.
This now, will form the starting point of the bearish descending triangle. Price will then form a lower high and be pushed back lower from sellers, back into the previous support. This price movement will be consistent over a few more times until we have the bearish descending triangle formed.
Look:
So in reality this is just the opposite to what the bullish ascending triangle would look like. So check out below my diagram of the bearish descending triangle.
There was two more occasions the support level was retested. Also creating two more lower highs hence forming the makeup of the flat bottom triangle.
You should now be catching on how these patterns are formed. So with learning these patterns, I suggest taking some time to now take a look on your own charts and see if you can spot these patterns.
Entry Criteria
When taking an entry with the trend using this formation. The typical entries are-
- Breakout entry of the bottom support level, with targeting a target at the same distance as from the first lower high to the support level within the formation. (This would be an more aggressive approach)
- As outlined on the above image, wait for the breakout and retest to take an entry. (This being a more conservative approach)
Just as the bullish ascending triangle, it’s important to remember the pattern isn’t confirmed until the breakout and close of the support. Always remember this one detail, and you will greatly improve your win to loss ratio!
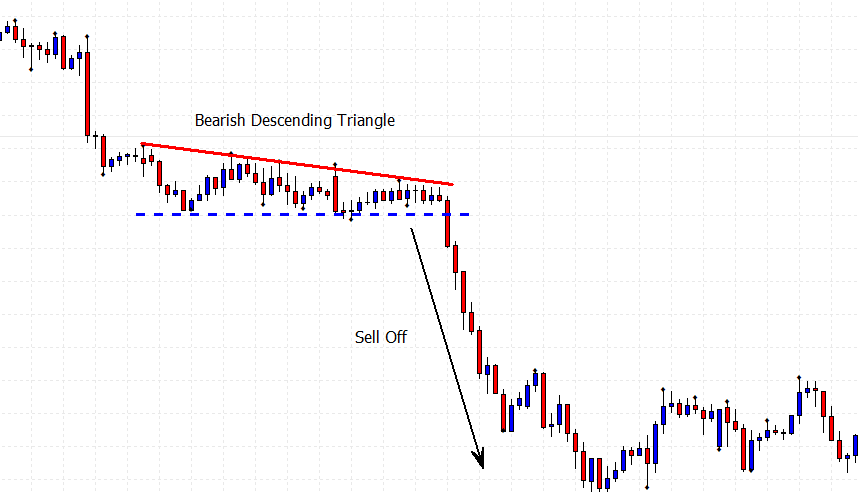
Lets see what a bearish descending triangle would look like on a price chart…
Bull Flag
One of my other favourite continuation price patterns, being the Bullish Flag pattern. Is one of the common retracement formations used to catch a entry with the bullish trend.
How does the bull flag actually form?
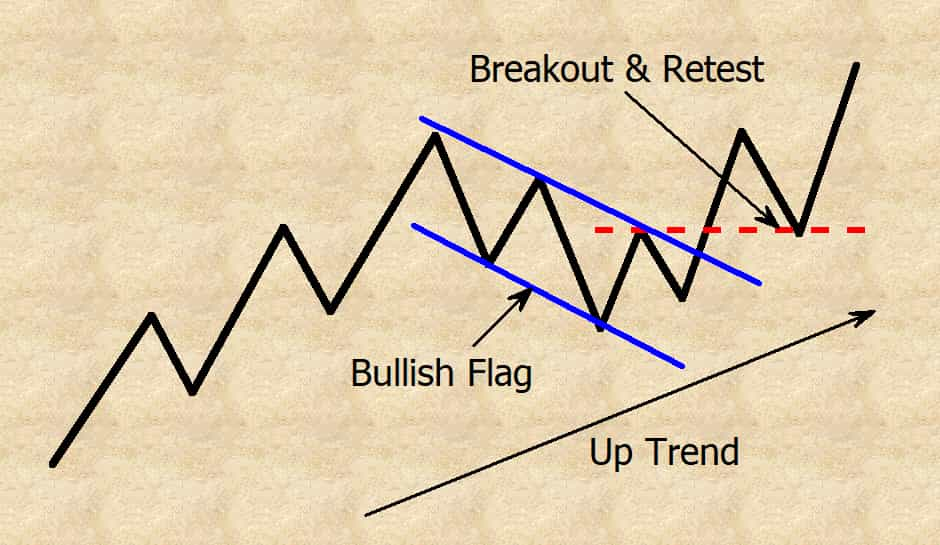
The Bullish Flag price pattern, will form after an extended up move. With a correction normally being what is called a AB-CD retracement. You would then expect price to reverse after the C-D move being the last leg down once the retrace has completed.
This pattern is often used in conjunction with Fibonacci retracement levels of the 50-61.8%.
Entry Criteria
As like the Bullish Ascending Triangle or the Bearish Descending Triangle. This pattern also has two entry types that you could implement.
The typical entries are-
- A Breakout entry of the channel top resistance trend line, with targeting a target using the previous bullish move that precedes the formation of the bullish flag. (This would be an more aggressive approach)
- As outlined on the image above, wait for the breakout and retest to take an entry with the bullish trend. (This being a more conservative approach)
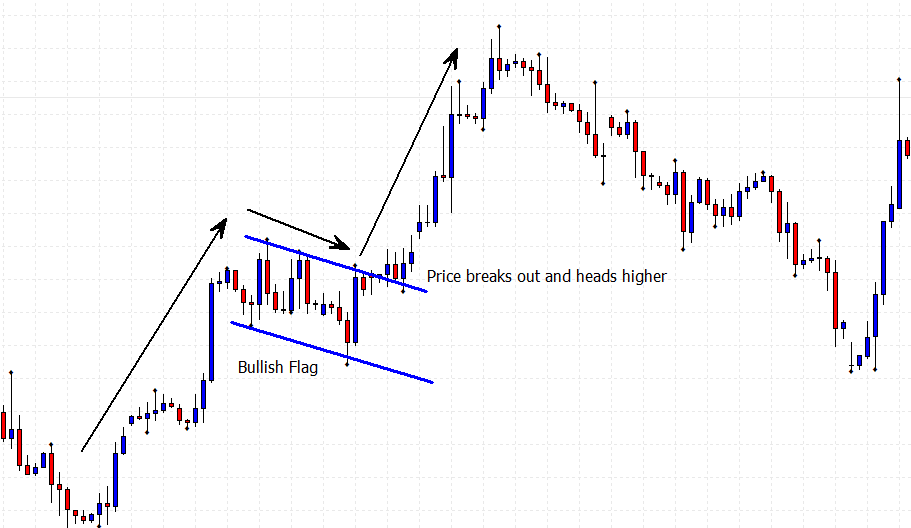
Just like all of the other technical price patterns, this pattern needs to be confirmed with the breakout of the bullish flag resistance level. From the image above, you will see how this pattern would look when formed.
Check out what a bull flag looks like on a price chart…
Bearish Flag
The Bearish Flag is basically the opposite of the Bullish Flag continuation price patterns. It’s one of the common retracement formations I use to catch a entry with the bearish trend.
How the Bearish Flag will form:
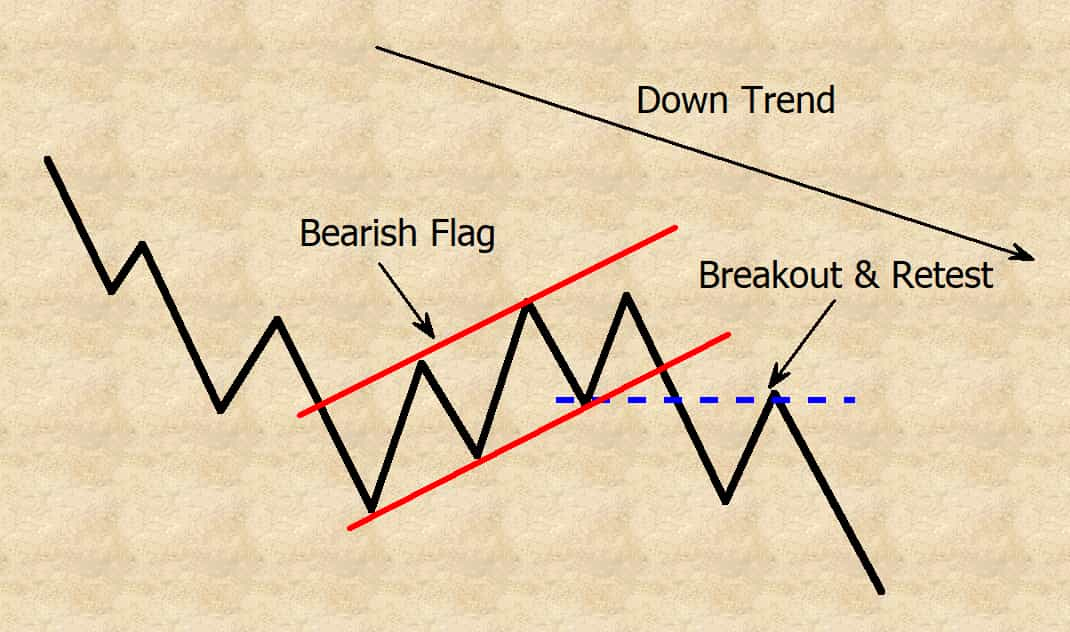
The Bearish Flag price pattern, will form after an extended down move, with the same correction as the Bullish Flag above. A trader would expect price to reverse after the C-D move being the last leg up of the retrace.
Once the retrace has completed, often used in conjunction with Fibonacci retracement levels of the 50-61.8%. Then you can prepare to watch for a trade entry with the bearish trend.
The entry criteria with a bearish flag pattern
On the image below, you will see how this pattern would look when formed. As like the Bullish Flag, this pattern also has two entry types that you could implement.
The typical entries are-
- The breakout entry of the channel bottom support trend line, with targeting a target using the previous bearish move that precedes the formation of the bearish flag. (This would be an more aggressive approach)
- As outlined on the image below, wait for the breakout and retest to take an entry with the bearish trend. (This being a more conservative approach)
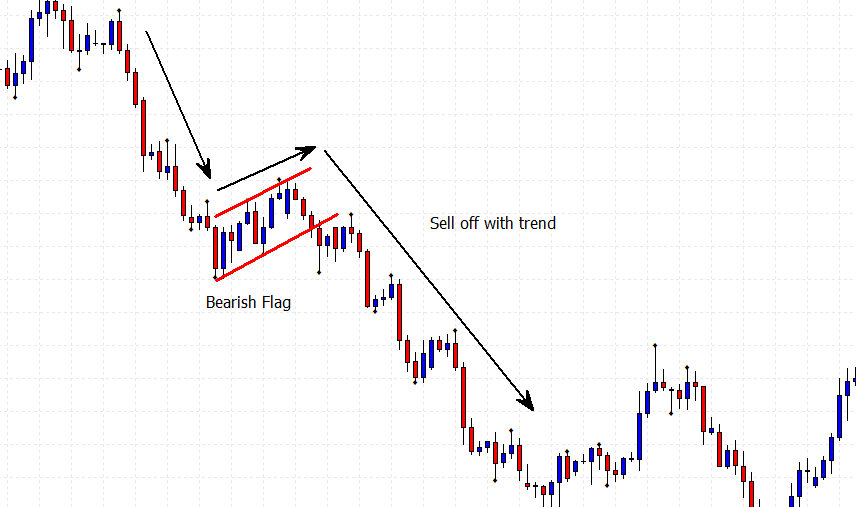
Once again I have to point out, this pattern is not confirmed as the bearish flag until price breaks and closes the support. Waiting for this to happen is what will form you into a successful trader.
Also it is how to make profits with continuation price patterns in Forex. Below is what a bearish flag pattern will look like on a price chart.
Bullish Consolidation Pattern
I’ve now covered the patterns that can give explosive moves with the trend. Now I will cover another pattern that you really need to understand before trading them.
The Bullish Consolidation pattern is another way how to make profits with continuation price patterns in Forex. Which is mostly found as price takes a breather in a strong up trend.
The one thing you need to know with using this pattern. Is it can also be known as a range bound market, but they are two different patterns.
Let me explain:
A range, is going to be a consolidation of price that will tend to form at the end of a strong trend or price movement. These will normally form as a reversal price pattern than one of the continuation price patterns I am covering now.
How you can determine this, will be with the direction of the pattern it breaks in. So with the continuation pattern, you will need to see it break in the same direction of the move preceding it. So it’s important you don’t mix up the two and try to trade a range pattern as a continuation pattern.
How the Bullish Consolidation pattern forms:
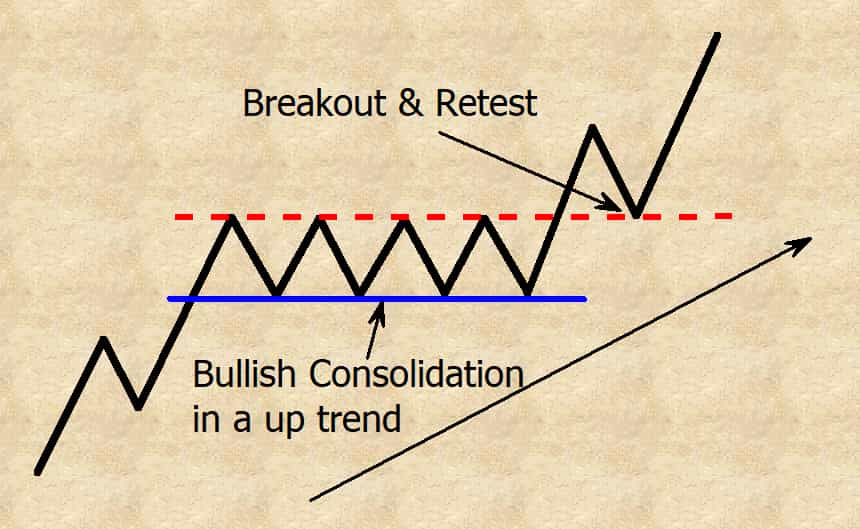
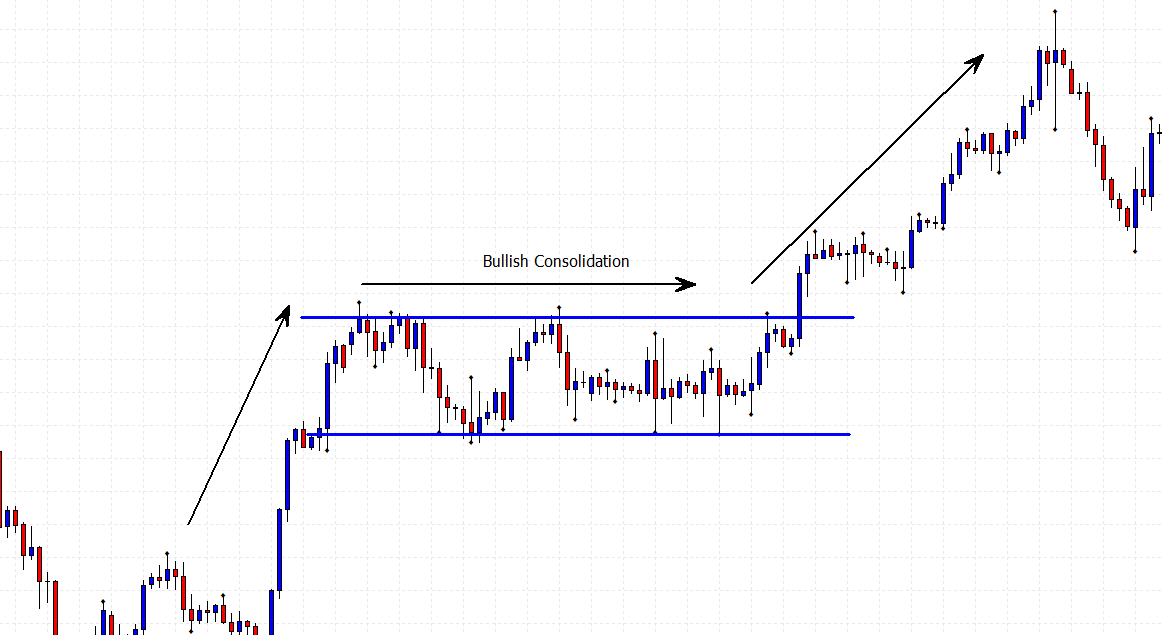
The Bullish Consolidation price pattern, will form after an extended up move in the market. What happens normally when you have this type of continuation price patterns. Is after price has been very bullish within the markets, it will need to take a breather.
This will normally show, where there is most likely some profit taking from previous buyers in the bullish trend. With you spotting these formations is key to catching trends within the markets. These tight formations, are the most common continuation plays you will see.
It will show a tight range fight between the bulls and the bears. Very often this consolidation pattern can form during when the markets are at their lowest trading volume. This being most likely while the Asian trading session is active, with the trend continuing with London market session opening.
On the image below, you will see how this pattern would look when formed-
Entry Criteria
Like the other continuation price patterns, the bullish consolidation pattern there are two entry types.
These typical entries are-
- The breakout entry of the consolidation top, with the stop below the consolidation. (This would be an more aggressive approach)
- As on the image above, wait for the breakout and retest to take an entry with the bullish trend. (This being a more conservative approach)
Don’t forget, you need to confirm the breakout into the trend direction for this pattern to be confirmed! Below is what this consolidation pattern would look like when on a price chart.
Bearish Consolidation Pattern
The Bearish Consolidation pattern is another pattern with how to make profits with continuation price patterns in Forex. It’s mostly found as price takes a breather in a strong down trend.
How it forms:
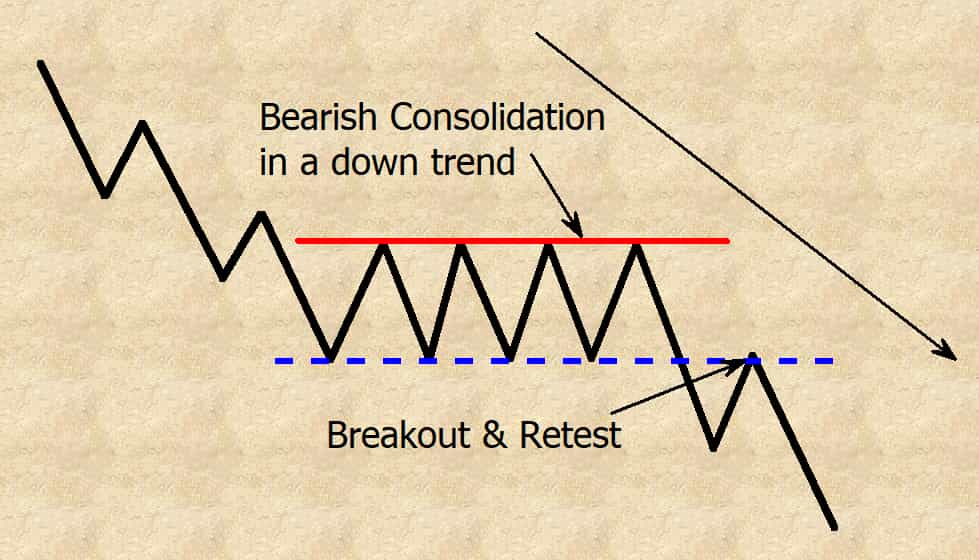
The Bearish Consolidation price pattern, will form after an extended down move in the market. This will be after price has been very bearish within the market, it will then need to take a breather. Normally this shows there is most likely some profit taking from previous sellers in the bearish trend.
Just as the bullish consolidation pattern, it will show a tight range fight between the bulls and the bears. Very often this consolidation pattern can form during when the markets are at their lowest trading volume.
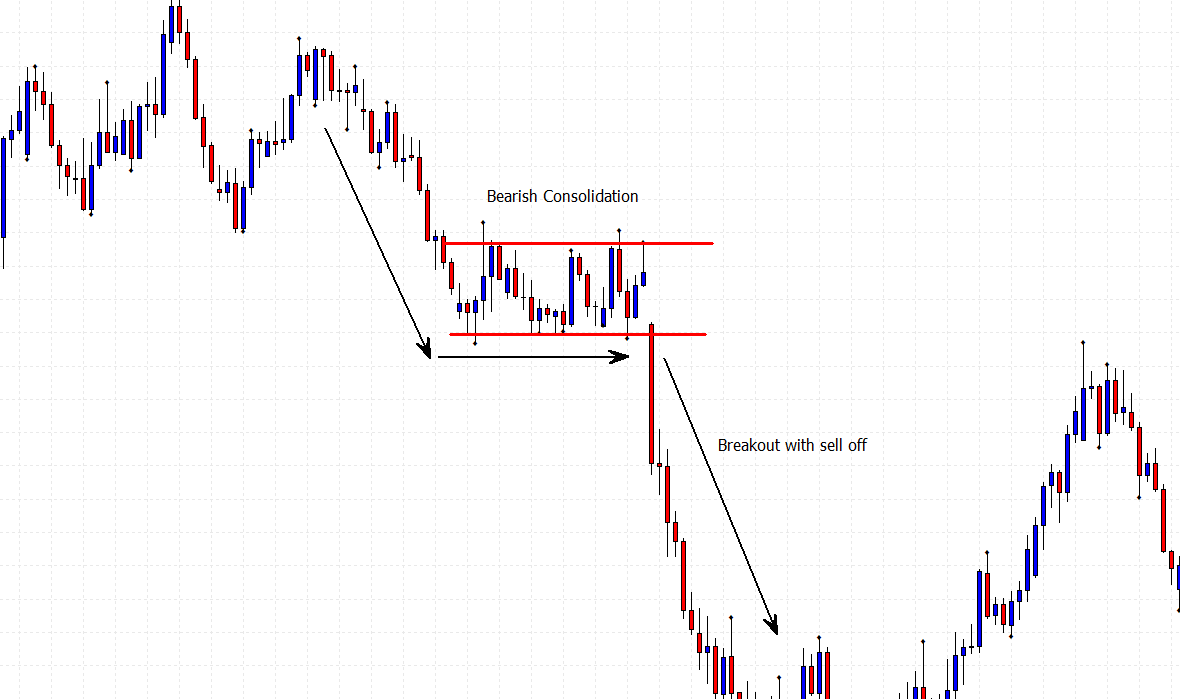
This being most likely just as the bullish consolidation pattern while the Asian trading session is active. With the trend continuing as the market opens again in the London session. On the image below, you will see how this pattern would look when formed.
The entry criteria for the bearish consolidation pattern:
As like the bullish consolidation pattern there are two ways you can trade this pattern-
- The breakout entry of the consolidation bottom, with the stop above the consolidation. (This would be an more aggressive approach)
- As on the image above, wait for the breakout and retest to take an entry with the bearish trend. (This being a more conservative approach)
Always remember to wait for the pattern to break and close in the direction of the trend, to confirm the pattern. This will stop you entering the trade too early and getting caught into any fake breakouts. Lets take a look on the price chart below, what this bearish consolidation price pattern looks like.
Bullish Symmetrical Triangle
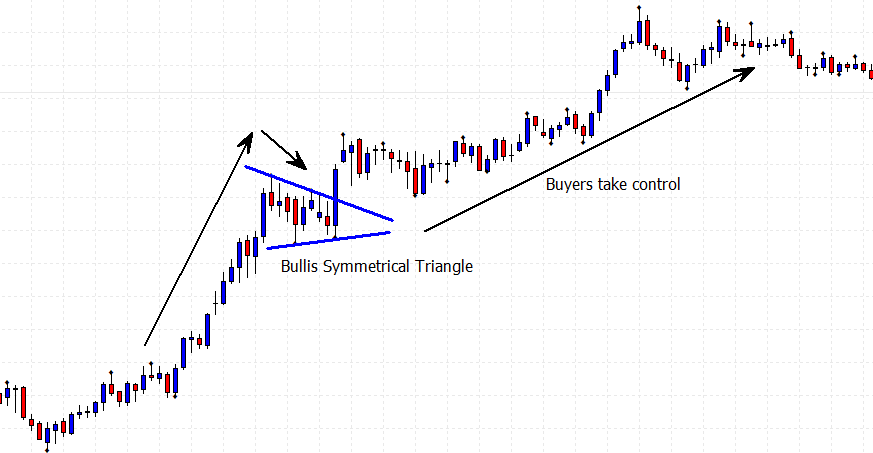
This brings me to the final continuation pattern with how to make profits with continuation price patterns in Forex. Being the Bullish Symmetrical Triangle pattern. This is another one of the continuation price patterns, which is mostly found as price takes a breather in a strong up trend.
How the Bullish symmetrical pattern forms:
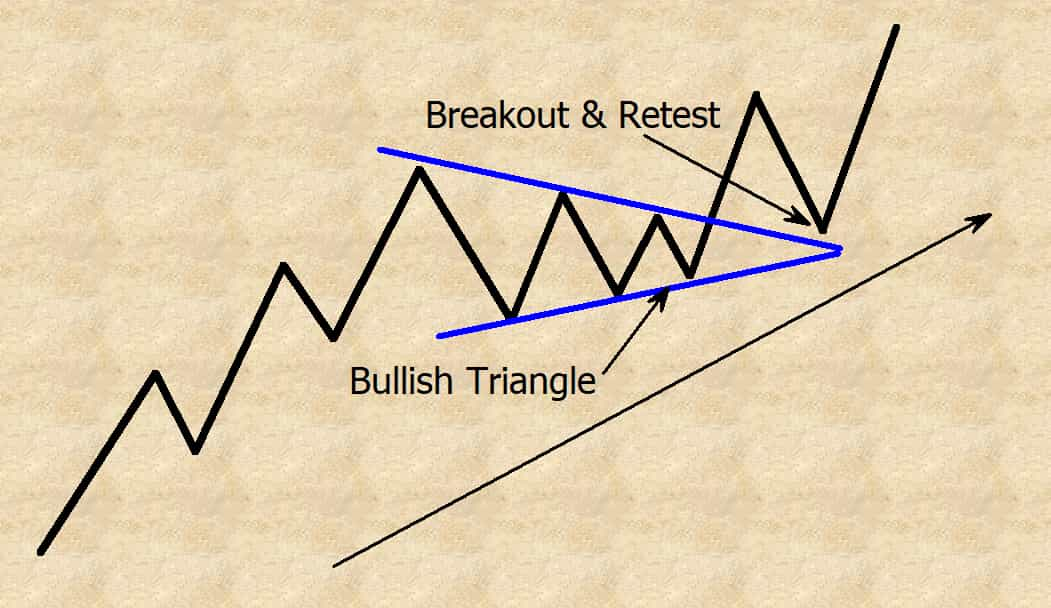
The Bullish Symmetrical Triangle price pattern, will form after an extended up move in the market. With this continuation price pattern, price will start to wind up forming a tighter range until price breaks out up or down.
Just as the consolidation price pattern, the bullish symmetrical triangle price pattern. Will show a breather in the markets after a strong bullish move was made. This can also demonstrate profit taking buy the buyers from the up move in the market.
The winding up of price, can been seen as on the image below, with price making higher lows and lower highs forming the pattern. Until price eventually breaks out of the pattern in the direction of the preceding trend.
Entry Criteria
The entry on this price pattern, is very much the same as the ascending and descending triangle patterns. All targets from this pattern are set from the widest section of the formation.
Then projected as a target from the breakout point of the symmetrical triangle. (known as the measured objective) You can learn more on another lesson I recently wrote and improve your Forex education with how you can use a measured objective for profit targets by clicking here.
These typical entries are-
- The breakout of the symmetrical triangle in line with the trend. With the stop placed below a higher low formed within the pattern. (This would be an more aggressive approach)
- As on the image above, wait for the breakout and retest to take an entry with the bullish trend. (This being a more conservative approach)
Just as all of the technical patterns I’ve discussed in this trading lesson today, always wait for the break and close of the pattern to confirm it. Below is a price chart showing what this symmetrical triangle would look like.
Bearish Symmetrical Triangle
With the Bearish Symmetrical Triangle pattern being the final pattern on how to make profits with continuation price patterns in Forex. It’s mostly found as price takes a breather in a strong down trend.
How this pattern forms:
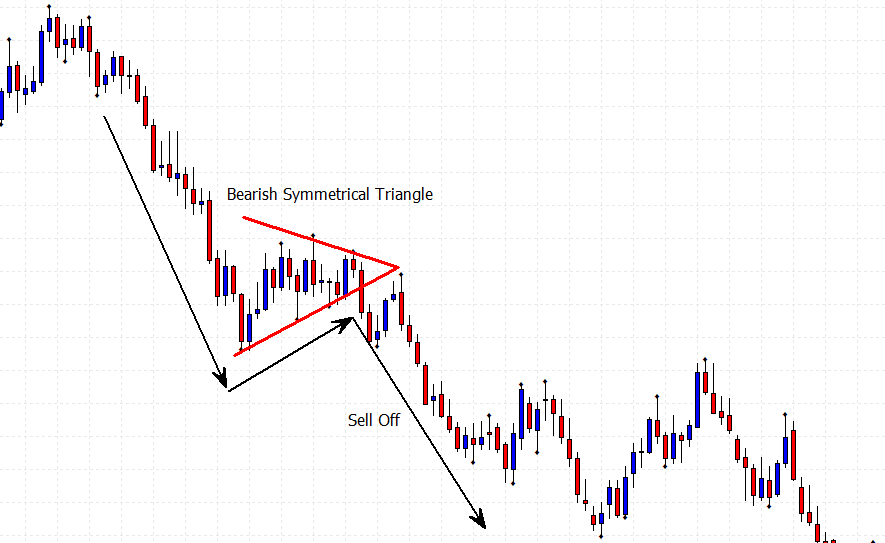
The Bearish Symmetrical Triangle price pattern, will form after an extended down move in the market. With this continuation price pattern, price will start to wind up forming a tighter range until price breaks out up or down.
As the Bullish symmetrical triangle price pattern, the Bearish Symmetrical price pattern. Will show a breather in the markets after a strong bearish move was made. This can also demonstrate profit taking buy the sellers from the down move in the market.
The winding up of price, can been seen as on the image below, with price making lower highs and higher lows forming the pattern. Until price eventually breaks out of the pattern in the direction of the preceding trend.
Entry Criteria
The entry on this price pattern, is the same as the Bullish symmetrical price pattern, just in reverse.
These typical entries are-
- The breakout of the symmetrical triangle in line with the trend. With the stop placed above a lower high formed within the pattern. (This would be an more aggressive approach)
- As on the image above, wait for the breakout and retest to take an entry with the bearish trend. (This being a more conservative approach)
As with every pattern I have covered in this trading lesson, remember to wait for the break and close of the pattern before confirming it. Always using this approach will help to control your trading emotions dramatically.
If you want to learn how to make money and control your emotions in trading, you will want to see my latest trading article I wrote by clicking here.
Check out what a bearish symmetrical triangle looks like on a price chart…
Get more basics of Forex trading here
Final thoughts on continuation price patterns
So in my trading lesson today I’ve covered all of the continuation formations I use with my trading, on a weekly basis. These explosive patterns will make you much more disciplined and profitable trader.
Always remember to wait for the valid break and close of the pattern, so you confirm the pattern before trading it. I suggest starting out with the more simpler patterns such as the ascending and descending triangles. Before moving onto the more complex patterns, such as the symmetrical triangles.
You should now know how to make profits with continuation price patterns in Forex. To further your trading education, I suggest going through another trading lesson all about how to trade reversal price patterns. Which you can go to right now by clicking here.

