
Are you looking to trade using the imbalance between supply and demand within your own trading. But, just not sure where or how to start with using the basics of supply and demand trading. If so then you’re in the right place!
The use of the basics of supply and demand trading will mean for a trader to find the imbalance, between sellers and buyers. An area of supply will form when there is an imbalance when the sellers overwhelm the buyers. The opposite is true when there is an area of demand, where the buyers overwhelm the sellers. Also learn how to draw supply and demand zones in Forex, with fresh supply and demand zones.
In today’s trading lesson naked traders, I will be discussing the basics of supply and demand trading.
What I will cover within this lesson:
- Imbalance in Forex market
- How to draw supply and demand zones in Forex
- Fresh supply and demand zones
- Supply and demand trading strategy
- Supply and demand trading course
The Imbalance Between Supply And Demand Trading In Forex
The imbalance between the supply and demand trading in Forex. Is when we look for an area of price that consolidates, that shows indecision within the markets between buyers and sellers.
The area of price action that shows the consolidation of a price range that will show uncertainty, is the formation of the supply or demand zone.
This basically is where sellers overwhelm buyers within the area of price on the chart, which forms the supply zone. And where the buyers will overwhelm the sellers which forms the demand zone.
Supply and demand in the Forex markets is easy to identify. The reason is because the Forex markets is a high liquidity market.
But most newbie or beginner traders fail to recognise, how the markets are moved by this imbalance of supply and demand, and look more to trade just with support and resistance. Unfortunately not understanding how to read the imbalance in the markets, they currently lose and become frustrated.
This is why it is so important for you to not only learn the use of price action with the difference between support and resistance. But also how to correctly read the markets with drawing supply and demand zones correctly.
How The Price Leaves A Supply Or Demand Zone
It’s also important for you to be able to identify clear imbalances away from a zone of supply and demand. How price leaves the level of supply or demand zone should be included as a trading rule within your strategy.
When you see price reversing the trend, you will have several considerations to consider;
- Was the imbalance away only a few candles, or a consolidation.
- Did price create a new high or low finding more orders.
- Is price showing uncertainty before dropping away from the zone created.
The imbalance between the basics of supply and demand trading, depends on the amount of orders. A large block of orders sitting at a zone, can reverse the market direction completely. In the same way the orders may not be enough to give an immediate change in the trend.
This is when you will see price forming the consolidation, and price will stay within the zone for a longer period before spiking and turning around.
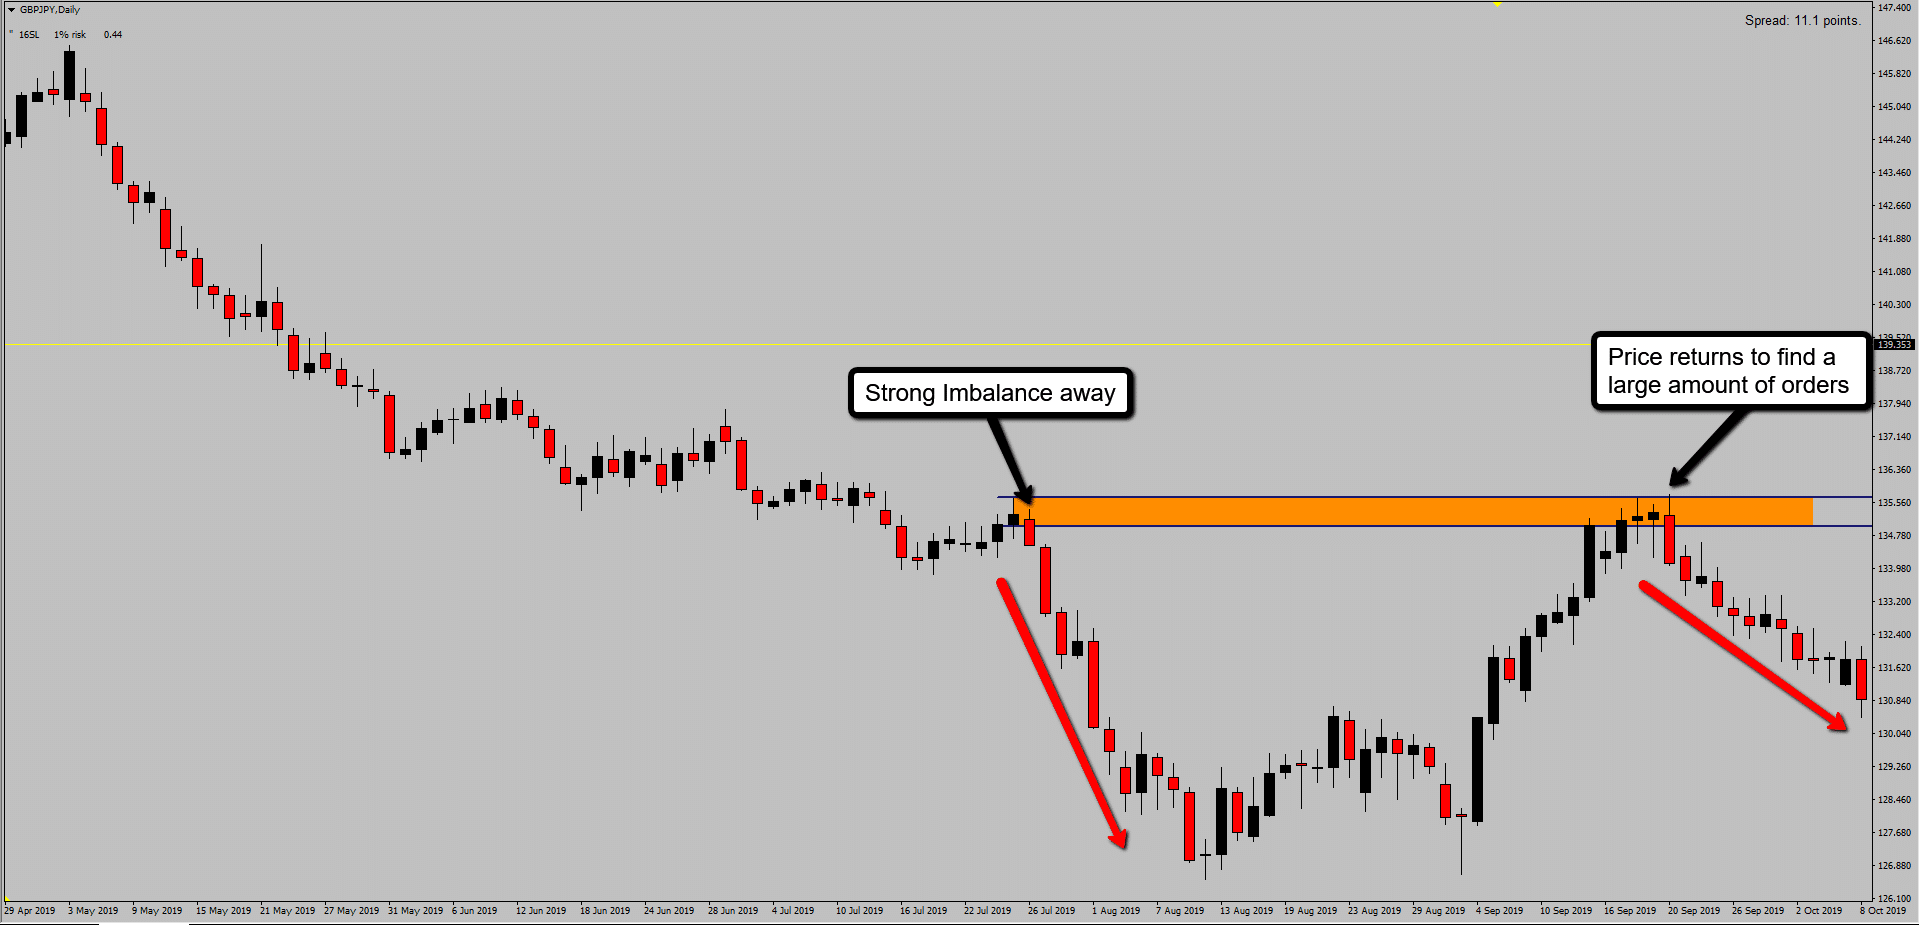
Strong Imbalance Away From A Supply Or Demand Zone
The best imbalance you would want to trade when looking for a supply or demand zone. Is the strong imbalance away from a supply or demand zone, where you will expect to find a large amount of orders waiting at the zone.
If you find a level that has a strong imbalance away, then it will likely give you the best entry. Once price returns to the zone there will be orders still waiting to push price away again in momentum.
Let’s take a look at what the strong imbalance looks like when a supply zone is formed.
A Persistent Area Of Supply Or Demand Zone
As well as a strong imbalance away from a zone, you can also look to trade when a zone is tested picking up more orders, know as a more persistent area of supply or demand zone. This is when the larger institutions need to add orders to their trades. Generally this will occur after they take profits on the first entry from a zone.
They then will look to take another entry at the same zone, and as a general rule the previous high or low will be removed showing there has been new orders added into the market.
Lets take a look at how this would look on a price chart;

Just remember, in any trade with supply and demand, when price is pushed deeper into the zone absorbing more orders these will be a lower risk trade to enter. But when price fails to push higher or lower into a zone these become your high risk trade setups.
How To Draw Supply And Demand Zones In Forex
To draw supply and demand zones in Forex you first need to understand the basics of how supply and demand zones are formed, and how to identify supply and demand zones on a price chart. This will include having an understanding of what the proximal and distal lines are within supply and demand zones.
You will draw a supply zone from the last bullish candle open price to the high of the candle, and you will draw the demand zone from the last bearish candle open price to the low of the candle.
So with the basics of supply and demand trading I will be covering exactly how I draw these zones on a day to day basis.
Being able to capture trades that end up in profit when trading with supply and demand. You first need to know how to draw supply and demand zones in Forex correctly.
Plus to further compliment this lesson, click here to get my totally free online workshop including the basics of drawing supply and demand.
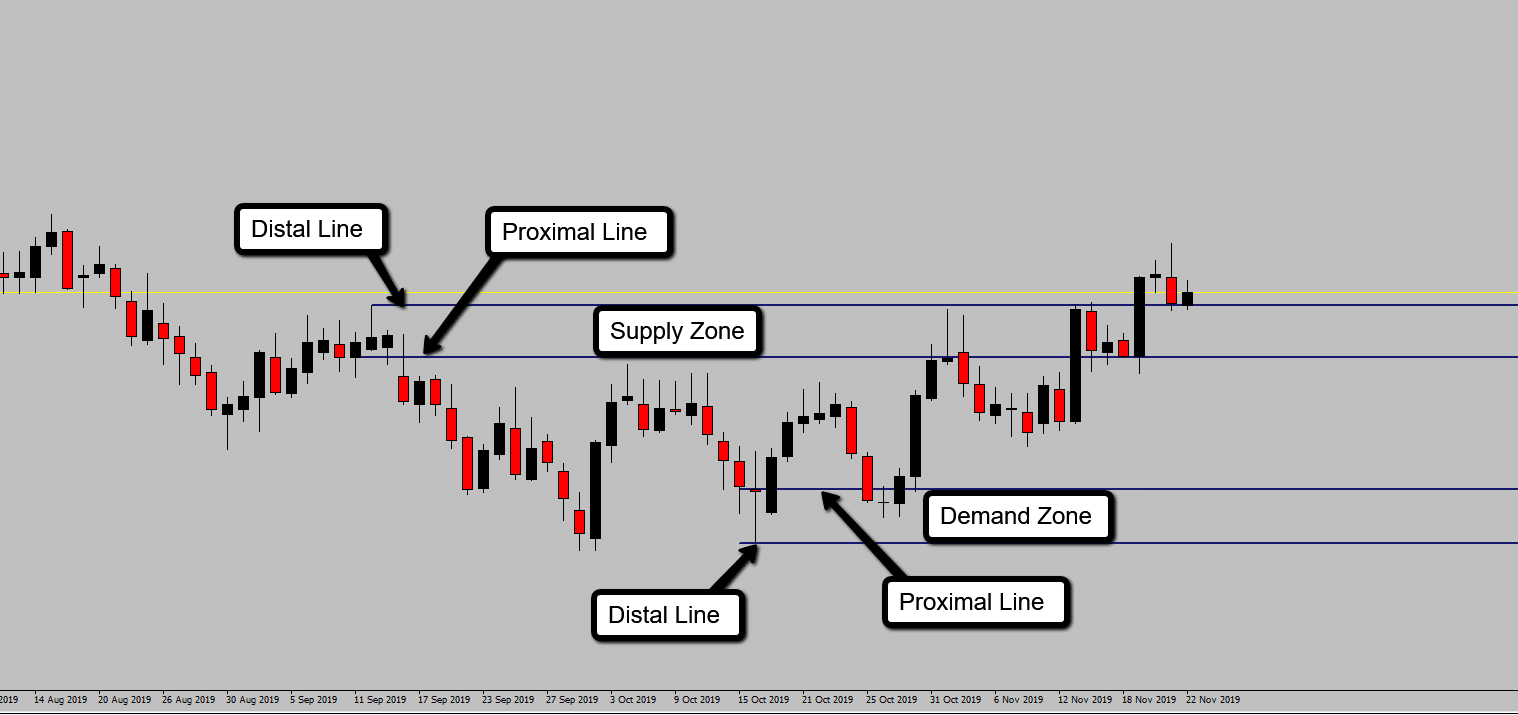
Proximal And Distal Lines When Drawing Supply And Demand Zones
When drawing supply or demand zones you will have what is called the proximal and distal lines. The proximal line will be the low level of a supply zone or the high of a level on the demand zone.
Where the distal line will be the outer level of the zone, which will be where the high of the supply zone or the low of the demand zone will be located.
These zones will be drawn when you see an area formed with a high imbalance in price. Or when there is a persistent area of supply or demand formed.
On the chart below will show the lines used that forms up the supply or demand zones.
Now you know what lines make up a supply or demand zone. I will now go into greater detail of drawing the zone on the chart. When drawing the supply zone, you will mark the last bullish candle in the up move as your supply zone.
So as shown on the image below, see how I have drawn the lines from the high of the bullish candle as the distal line and the proximal line at the open price of the bullish candle.
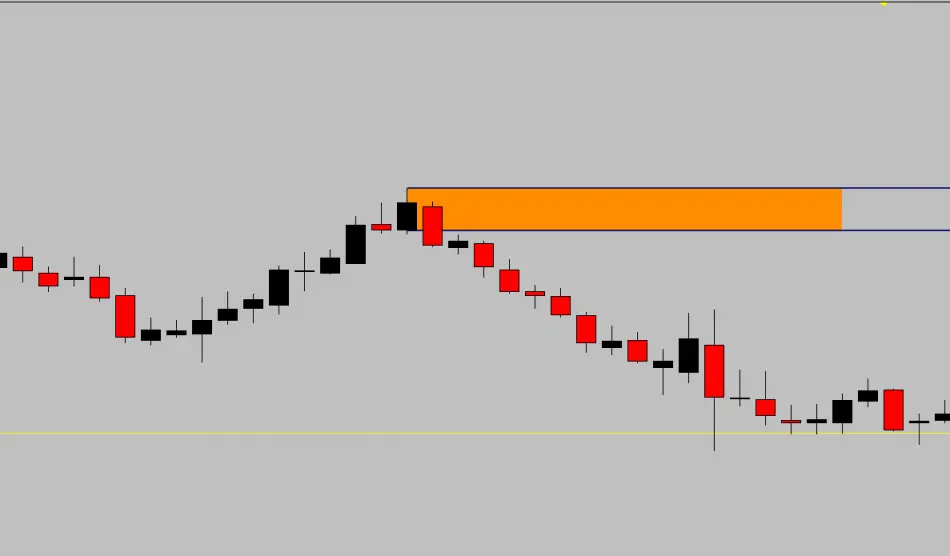
The opposite is true for the demand zone, you would draw this zone with the distal line as the low of the bearish candle with the proximal line as the open price of the bearish candle.
So there are the basics of supply and demand trading with the drawing of the zones.

To further develop your skills of understanding and drawing of the supply and demand zones. Make sure you take my free online workshop including a mini course on supply and demand trading basics by clicking here.
Fresh Supply And Demand Zones In Forex Trading
Now you understand how to draw supply and demand zones in Forex with the basics of supply and demand trading. The next step to becoming a supply and demand Forex trader is to understand the difference between fresh and tested zones of supply and demand.
The main difference will be if price has revisited the zone of supply or demand after forming. The technique of finding fresh zones is in fact quite simple to master, and will allow you to find higher profitability trades in doing so.
Lets now take a look at what a fresh area of supply or demand will look like compared to a tested zone of supply or demand on your charts.

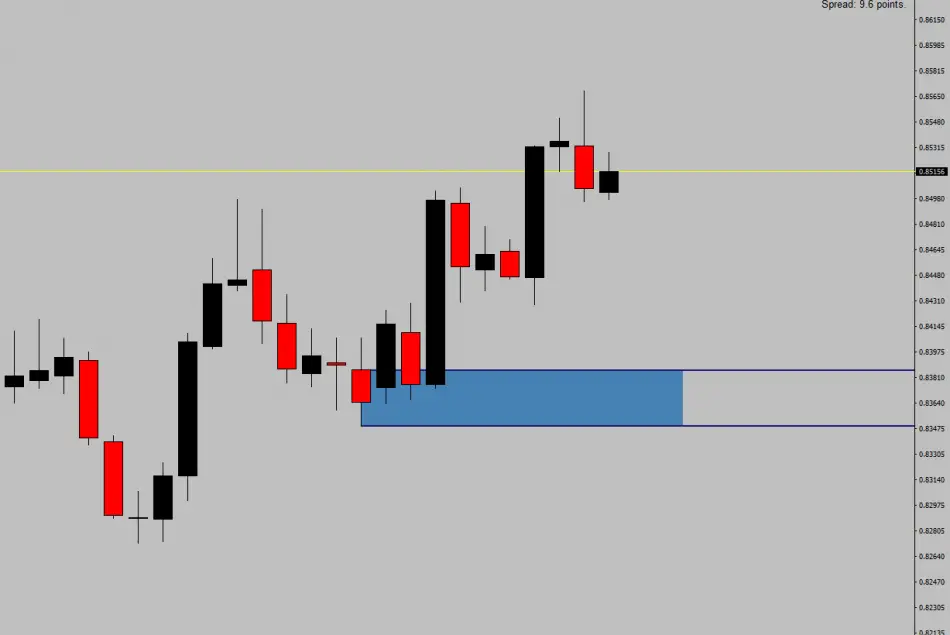
You will be able to see, when the supply zone was created, price just fell away without testing the zone until price returned to the formed supply zone. This then gave an opportunity to take a sell trade in the desired direction as price starts to drop lower.
But on the demand zone, when it was formed after removing the previous high and supply zone in he market. It in fact tested the demand zone on two occasions as highlighted above before heading higher. So any buy trades off this demand zone will have greater risks involved as the zone has been already tested and used with buy orders on two occasions.
As you will be able to see, finding fresh vs tested zones of supply and demand using the basics of supply and demand trading is going to be an easy task. Not only will it prevent getting caught on a trade which has less chance of succeeding with orders already been used up. It is also going to allow you to find the best probability set ups to trade!
When applying everything you have now learnt with the basics of supply and demand trading. This will allow you to create your very own supply and demand trading strategy.
Supply And Demand Trading Strategy
Your next step with going through the basics of supply and demand trading, will be to understanding how to create your own Forex trading strategy with supply and demand.

It just so happens, I have recently wrote an article all about how to create your own Forex strategy. Within this article you will learn the 11 steps I use when looking at creating a Forex strategy to trade the markets.
These 11 steps will be as follows:
- Understand the markets and form your ideology
- Choosing the correct time frame to trade
- Finding the right currency pairs to trade
- Use of an added aide to show the trend
- Define your risk
- Define your entry trigger
- Plan your exit rules
- Create a Forex trading plan and follow it!
- Back testing
- Demo trading
- Live trading
So once you have finished reading today’s trading lesson on the basics of supply and demand trading. Why not head over to this article on how to create your own Forex strategy with using supply and demand by clicking here.
Supply And Demand Trading Course
Perhaps you don’t have the time to create your own Forex strategy, or you are looking for an already developed trading course all around the basics of supply and demand trading and further advanced techniques.
If this is you, and you want to learn a whole new technique of trading naked with the use of supply and demand. Plus, understanding how to control risks within the Forex markets with eliminating risk as soon as possible.
Then you will want to check out my newly developed advanced supply and demand trading course, with a massive 60% discount right now for a limited time only by clicking here to go through to the membership site.
Final Words
Lets now wrap things up with what you’ve learnt in today’s trading lesson on the basics of supply and demand trading.
I covered the imbalances within Forex of supply and demand, with how price leaves a zone with either a strong or persistent imbalance will greatly give you an indication if it is a zone for you to draw and even trade!
Then I covered the correct way to draw your supply and demand zones on your charts. With using the proximal and distal lines, will allow you to mark out your zones correctly to trade. Plus don’t forget the free course on the basics of supply and demand trading which you can go to by clicking here.
You then learnt how to find fresh vs tested supply and demand zones, and why it is important to look to trade those fresh zones of supply and demand to capture the highest probability trade setups.
Finally I covered using everything you have learnt in today’s lesson on the basics of supply and demand trading to create your own Forex strategy to trade the markets with supply and demand. To check out that latest trading article on how to create your own Forex strategy. You can do so by clicking here.
