Do you want to use supply and demand in your trading but need to know how to draw supply and demand zones in Forex trading? If so, then you’re in the right place!
What is that correct path to drawing the zones of supply and demand?
To draw supply and demand zones in Forex you first need to understand the basics of how supply and demand zones are formed. This will include having an understanding of what the proximal and distal lines are within supply and demand zones. You will draw a supply zone from the last bullish candle open price to the high of the candle, and you will draw the demand zone from the last bearish candle open price to the low of the candle.
How Supply And Demand Zones Are Formed On A Price Chart
When it comes to how to draw supply and demand zones in Forex. The first thing you need to understand as a new trader to supply and demand trading, is how these zones of supply and demand are actually formed.
An area of supply or demand is formed when there is an imbalance in price within the Forex markets. This means we look for an area of price that consolidates, that shows indecision within the markets between buyers and sellers.
This is an area of price action that will show the consolidation of a price range. That will show uncertainty between buyers and sellers, and is the formation of the supply or demand zone.
Supply and demand in the Forex markets is easy to identify. The reason is because the Forex markets is a high liquidity market.
Now you understand how the zones are formed, the next step is to know how the zones are drawn on your charts. These zones are drawn with what is called the Proximal and Distal lines.
Proximal And Distal Lines In Supply And Demand Zones
With how to draw supply and demand zones in Forex, a supply or demand zone you will have what is called the proximal and distal lines.
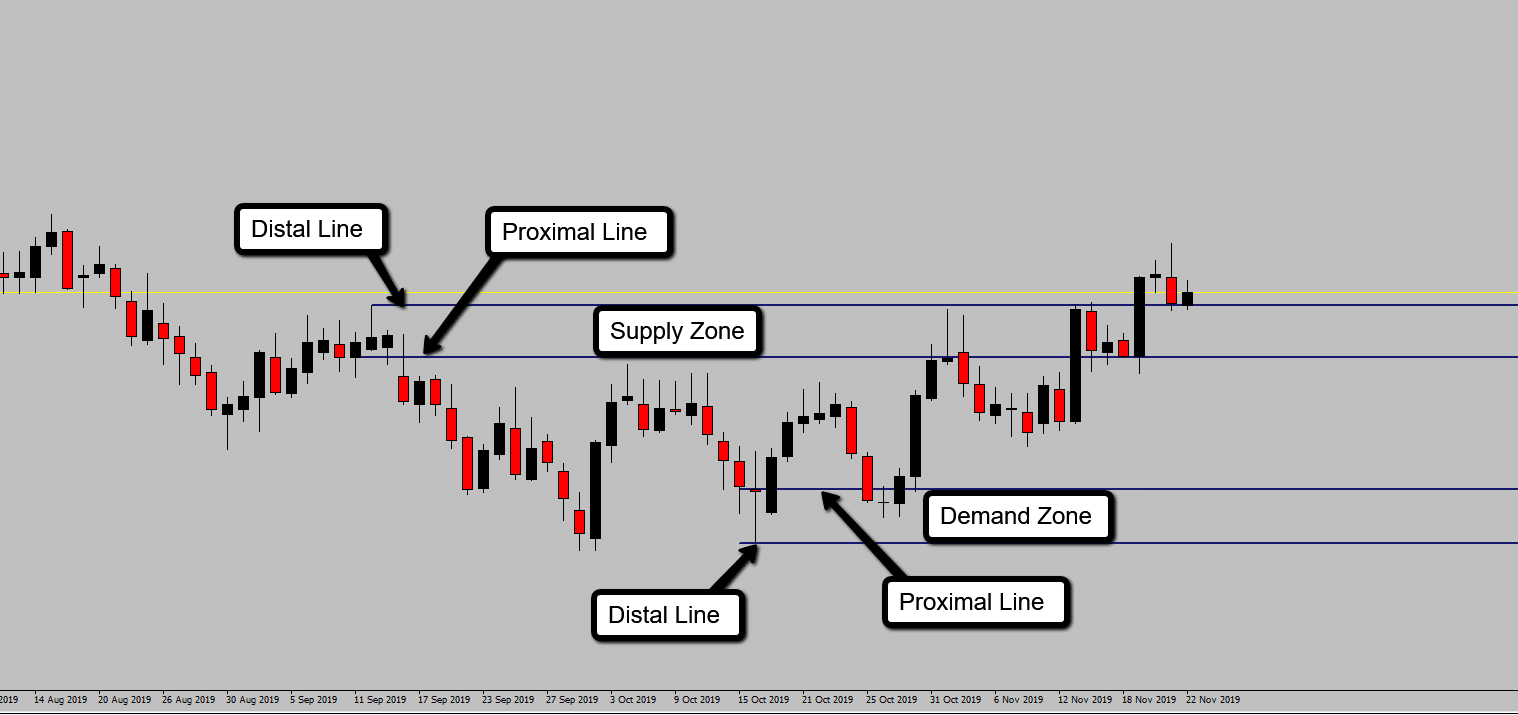
The proximal line will be the bottom level of a supply zone, which is marked at the open price of a bullish candle. Or the proximal line will be the high of a demand zone level which is the open price of a bearish candle.
Where the Distal line would be the high of a supply zone, drawn at the last high of the move before price fell away. And the Distal line would be the low of the demand zone at the last low of the move before price continued higher.
See the price chart below, which will show the Proximal and Distal lines used that forms up the supply or demand zones.

Now you will have a good understanding of what the Proximal and Distal lines are and how they are used to draw the zones of supply and demand. Next I will cover how to draw supply and demand zones in Forex with some text and complimentary videos.
FREE ONLINE WORKSHOP

To further develop your skills of understanding and drawing of the supply and demand zones. Make sure you take my free online workshop on supply and demand trading basics by clicking here.
How To Draw Supply & Demand Zones In Forex Trading
Most traders find that a visual demonstration of how to draw supply and demand zones in Forex is the fastest way of learning how to actually draw zones for yourself.
So, below find a video that I will walk through with how to draw supply and demand zones in Forex.
Supply And Demand Trading Course
Perhaps you don’t have the time to create your own Forex strategy, or you are looking for an already developed trading course all around the basics of supply and demand trading and further advanced techniques.
If this is you, and you want to learn a whole new technique of trading naked with the use of supply and demand. Plus, understanding how to control risks within the Forex markets with eliminating risk as soon as possible.

Then right now is the time to check out my newly developed advanced supply and demand trading course, with a massive 60% discount for limited time only by clicking here to go through to the membership site.
Final Words
Lets now wrap things up with what you’ve learnt in today’s trading lesson on how to draw supply and demand zones in Forex.
First I covered how supply and demand zones are actually formed, with the imbalance of price as it consolidates with the uncertainty between sellers and buyers in the markets.
Then I covered the use of the Proximal and Distal lines and how these will create the formation of the supply and demand zones on your charts. With the Proximal line forming the low of the supply zone and the high of the demand zone. And the Distal line forming the high of a supply zone and the low of a demand zone.
Finally I covered how to draw supply and demand zones in Forex with the two videos. With one on the best way to draw demand zones and the other video with the best way to draw supply zones.
Using everything you have learnt in today’s lesson on how to draw supply and demand zones in Forex. Your next step with drawing supply and demand zones is going to very simple once you have mastered the basics of supply and demand trading.
If you want to further your knowledge with supply and demand then check out my previous post all on supply and demand trading basics clicking here.
